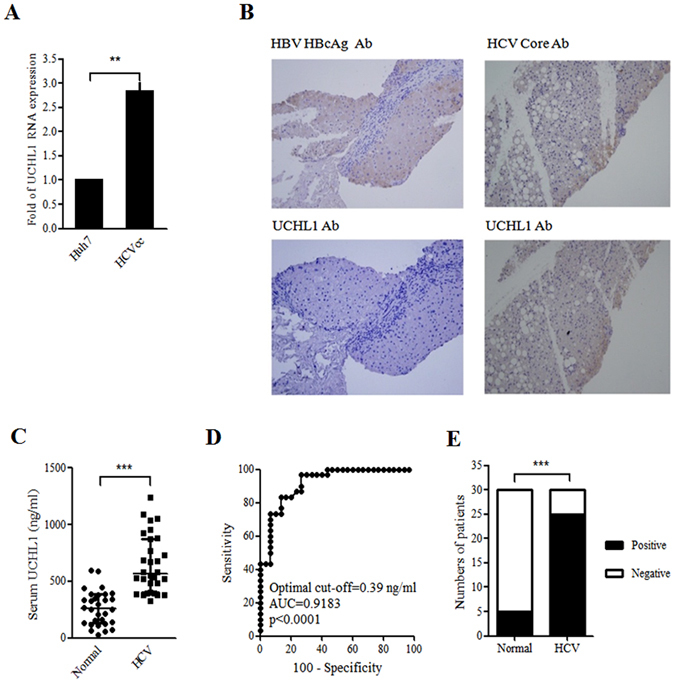
Figure 4.

HCV induced UCHL1 expression in Huh7 cells and in the liver section and plasma of hepatitis C patients. (A) Huh7 cells were infected with HCVcc (JFH1, MOI 1) for 4 h and cultured for an additional 72 h after removing HCV infectious particles by washing three times with DMEM followed by suspension of the Huh7 cells in DMEM supplemented with 2% FBS. The cellular RNAs were collected for real-time RT-PCR analysis of UCHL1 mRNA expression. The data represent the mean ± S.D. of 3 independent experiments. **p < 0.01. (B) Liver biopsies from patients with CHC (right panel) and CBC (left panel) were subject to immunohistochemical staining of the indicated viral markers (upper panel) and UCHL1 (lower panel), respectively. Representative data are shown. The original magnification was 200X. (C) The expression levels of UCHL1 in the plasma of the healthy control and the patients with CHC were analyzed by ELSA assay. The plasma level of UCHL1 for each individual was shown in the scatter dot plot. The medium and the interquartile range for each group are indicated by the horizontal lines. ***p < 0.001. (D) ROC curve analysis was used to predict the clinical significance for the expression of plasma UCHL1. For the best compromise sensitivity/specificity, the area under the ROC curve was 0.9183 (95% CI: 0.8508 to 0.9859, p < 0.0001) with a sensitivity of 83.3% and a specificity of 86.7% for a cut-off value of 0.39 ng/ml. AUC, area under the curve; CI, confidence interval. (E) The individuals with plasma UCHL1 greater than 0.39 ng/ml were considered as positive for the UCHL1 test. The number for the healthy control and the patients with CHC who were positive and negative for the UCHL1 test are shown (n = 30). ***p < 0.001.
