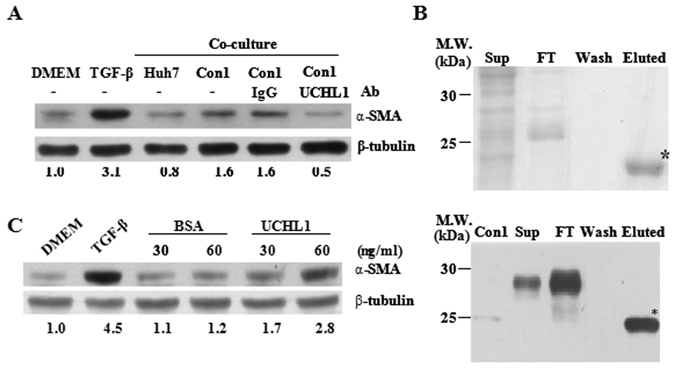
Figure 5.

UCHL1 induced HSCs activation. (A) HSC-T6 cells (1 × 10⁶ cells) were co-cultured with Con1 or Huh7 cells (1 × 10⁵ cells) in the presence or absence of anti-UCHL1 antibody or mouse IgG control antibody for 24 h. The HSC-T6 cell lysate was collected and the expression of α-SMA was determined by Western blot analysis. HSC-T6 cells treated with DMEM and TGF-β1 were used as the negative and positive control of HSC activation, respectively. The expression of β-tubulin was used as the control for equal protein loading. The number below the gel images represents the relatively α-SMA expression levels for the indicated experimental condition after normalization with the expression of β-tubulin. (B) Recombinant UCHL1 protein fused to the Profinity eXact tag was expressed in E. coli BL21 after IPTG induction. Samples from the indicated purification steps were fractionated on a 12% SDS-PAGE and stained with Coomassie Brilliant Blue (upper panel). The protein with an expected molecular weight of UCHL1 (21 kDa) was noted in the eluted fraction after protease cleavage of the Profinity eXact tag and was indicated as *. The recombinant UCHL1 protein in the indicated steps of protein purification was further confirmed by Western blotting using the anti-UCHL1 antibody (lower panel). The cell lysate of Con1 was used as a positive control. (C) HSC-T6 cells were culture in DMEM w/o FBS for 24 h and then treated with the indicated concentrations of purified rUCHL1 or BSA for an additional 24 h. The cell lysates were collected and the expression of α-SMA was determined by Western blot analysis. The expression of β-tubulin was used as the control for equal protein loading. The number below the gel images represents the relatively α-SMA expression levels for the indicated experimental condition after normalization with the expression of β-tubulin. HSCs treated with DMEM and TGFβ1 (10 ng/ml) were used as negative and positive controls for HSC stimulation, respectively. The full Western blot and the corresponding positions of the molecular weight protein markers are presented in Supplementary Fig. S3.
