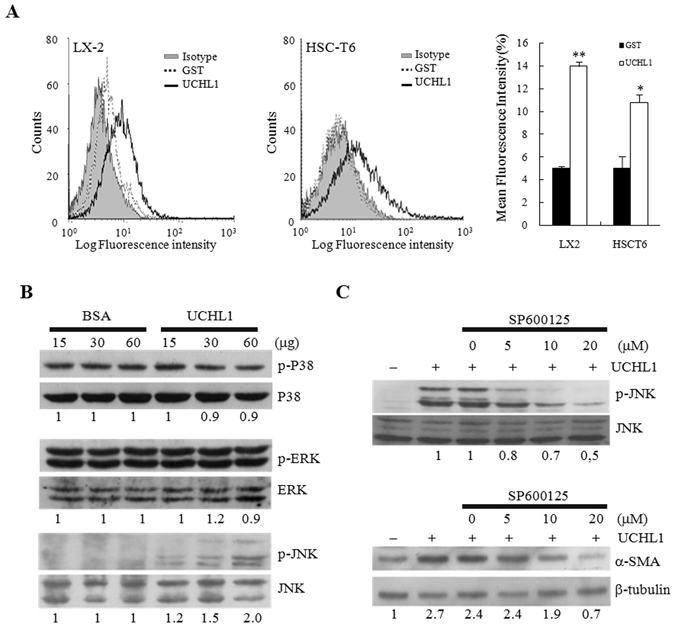
Figure 6.

The underlying mechanism of UCHL1-induced HSC activation. (A) Purified UCHL1 or GST protein (60 μg) was preincubated with 1 × 106 LX2 (left panel) or HSC-T6 (middle panel) cells, respectively. The binding of these proteins to the membrane surface of the cells was determined by incubation of anti-UCHL1, anti-GST, and isotype control antibodies, respectively, followed by incubation of FITC-conjugated goat anti-mouse secondary antibody and flow cytometric analysis. Purified GST protein was used as a control for non-specific binding. Isotype control IgG was used as the negative control. The mean fluorescence intensity for the indicated protein binding is shown in right panel. (B) HSC-T6 cells were treated with increasing concentrations of BSA or purified rUCHL1 protein for 24 h. The expression and the phosphorylation status of p38, ERK and JNK were analyzed by Western blotting. (C) HSC-T6 cells were treated with the indicated concentrations of the JNK inhibitor SP600125 for 30 min in DMEM supplemented with 0.2% FBS. Purified rUCHL1 (60 μg) protein was then added into the culture medium for 1 h to analyze the phosphorylation status of JNK and for 24 h to determine the expression of α-SMA. The expression of β-tubulin was used as the control for equal protein loading. The number below the gel images represents the relative α-SMA expression levels after normalization with the expression of β-tubulin. The full Western blot and the corresponding positions of the molecular weight protein markers are presented in Supplementary Fig. S4.
