Figure 4.

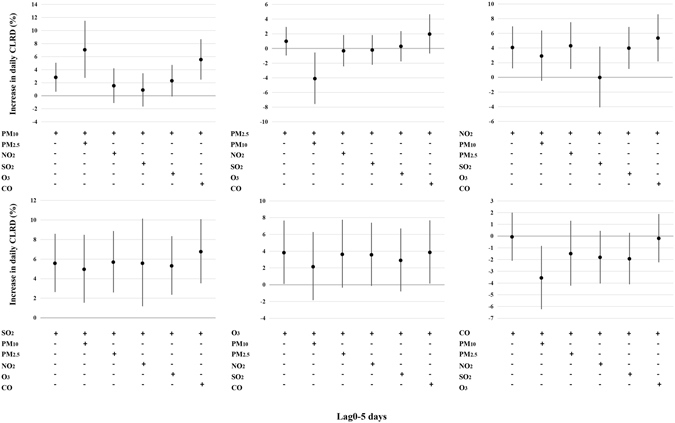
Estimated changes with 95% confidence intervals in daily CLRD percentage deviations (%) associated with an interquartile range increase in PM10, PM2.5, NO2, SO2, O3 or CO concentrations (lag0–5 days) in two-pollutants model.

Estimated changes with 95% confidence intervals in daily CLRD percentage deviations (%) associated with an interquartile range increase in PM10, PM2.5, NO2, SO2, O3 or CO concentrations (lag0–5 days) in two-pollutants model.