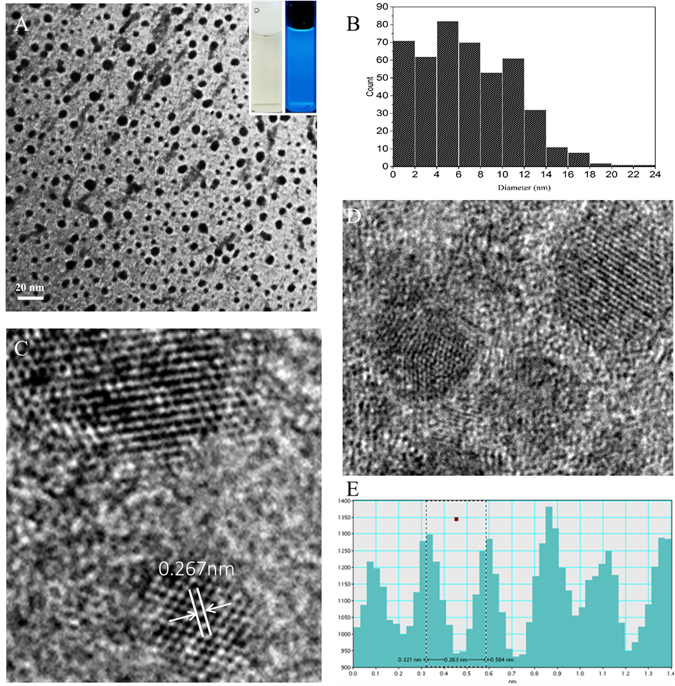
Figure 2.

(A) Transmission electron microscopy (TEM) image of egg yolk oil carbon quantum dots (EYO CDs). (magnification 145,000x), the accelerating voltage was 100 kV. (B) Histograms of particle size distribution of EYO CDs. (magnification 880,000x), the accelerating voltage was 200 kV. (C and D) High-resolution TEM (HRTEM) images of individual EYO CDs. (E) The line profiles of the corresponding HRTEM images of EYO CDs. The lattice fringe (d = 0.267 nm) induced from the inplane diffraction of graphene.
