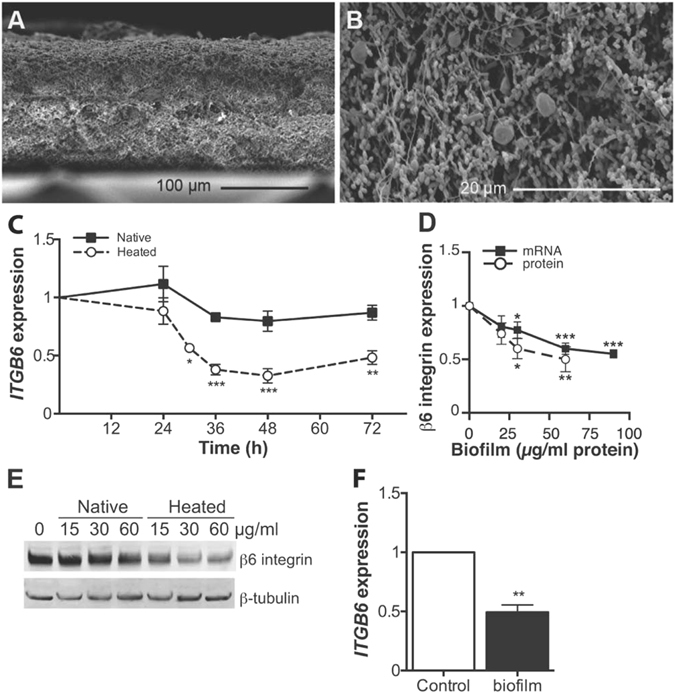
Figure 2.

Structure of the bacterial biofilm and its effect on GEC β6 integrin expression. (A and B) Cross section SEM micrographs of multi-species oral bacterial biofilms cultured for three weeks showing the structural features of the biofilm. (A) scale bar = 100 μm; (B) scale bar = 20 μm. (C) The time course of β6 integrin mRNA expression in GECs treated with native or heated biofilm extract (#4 biofilm; 60 µg protein/ml) relative to untreated cells. Mean ± SEM of three experiments is presented. (D) Integrin β6 mRNA and protein expression in GECs treated with different amount of heated biofilm extract (#4 biofilm) for 32 and 48 h, respectively. The protein levels were quantified relative to β-tubulin. Mean ± SEM of five experiments is presented. (E) Representative Western blot image of the total β6 integrin protein levels in GECs treated with various doses of native or heated #4 biofilm extract for 48 h relative to β-tubulin. (F) Primary human GECs were exposed to heated oral biofilm extract (60 µg protein/ml) for 30 h and the relative gene ITGB6 expression analyzed by RT-qPCR. Mean ± SEM of three experiments is presented. *p < 0.05; **p < 0.01; ***p < 0.001.
