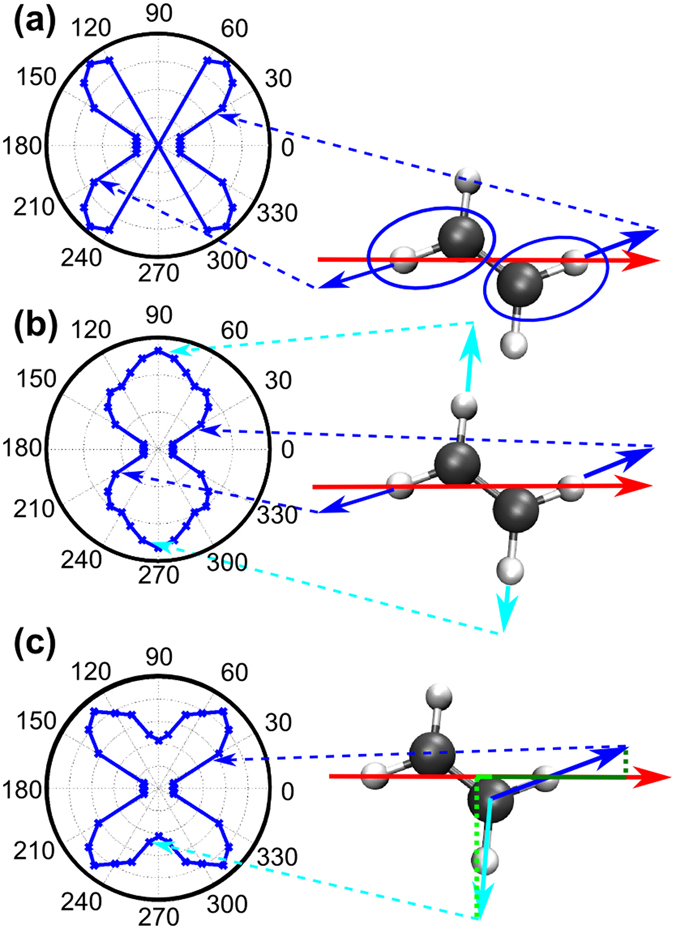
Figure 5.

Schemes for calculating the photofragment angular distributions in C2D4 (right) and corresponding results (polar plots, left). The red arrow indicates the direction of the dipole field. The dashed arrows relate the orientation of the molecule to the dipole vector with the angle between the field and the dissociation direction plotted in the polar diagram. (a) Contributions from the hole localized at “nearby” C-H bonds only. The blue vectors indicate the dissociation direction of these H-atoms. (b) The hole delocalizes quickly, allowing all C-H bonds to dissociate with equal probability. The cyan vectors indicate the dissociation direction of the more remote H-atoms (c) Contributions to dissociative ionization yield are weighted partially by their projection to the dipole vector which is indicated by the dark and light green line, respectively (see Eq. (4)). The individual projections are indicated as dotted lines.
