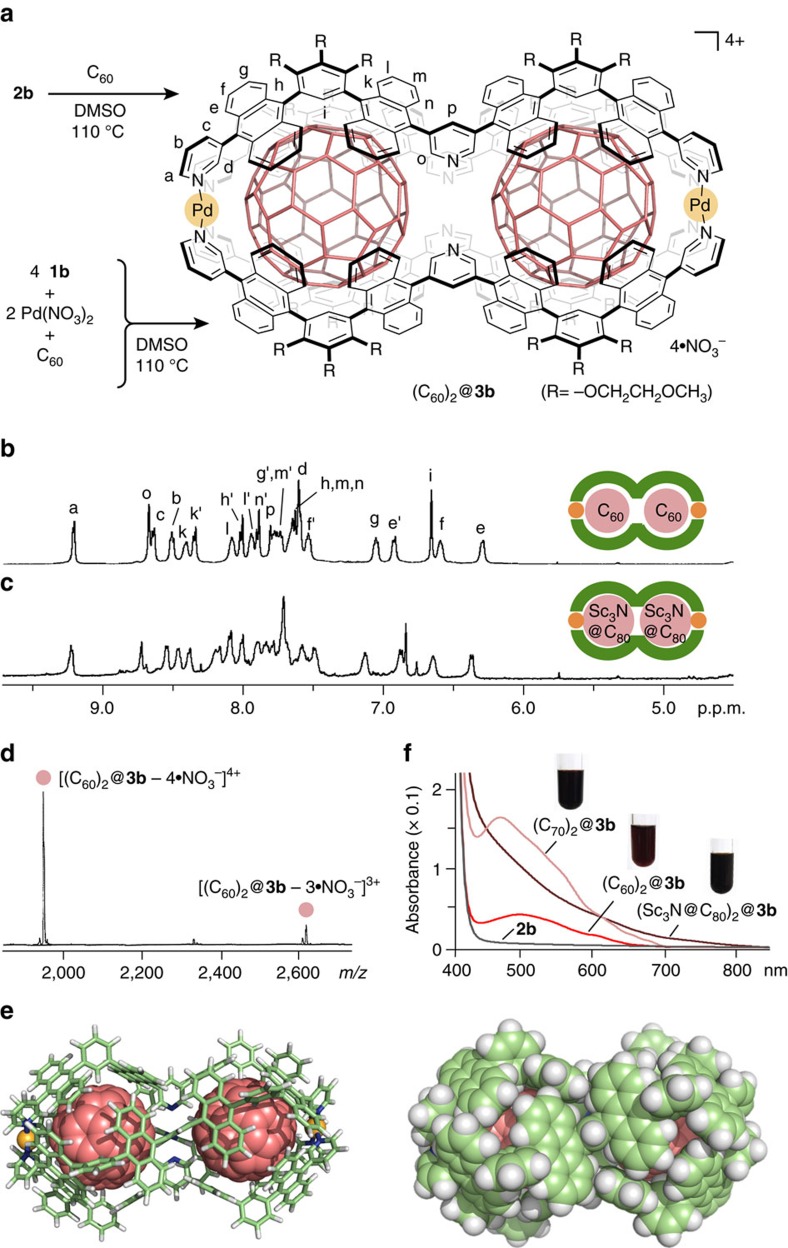
Figure 4. Quantitative formation and characterization of molecular peanuts.
(a) Schematic representation of the formation of polyaromatic molecular peanut (C60)2@3b. 1H-NMR spectra (500 MHz, DMSO-d6, room temperature) of (b) (C60)2@3b and (c) (Sc3N@C80)2@3b. (d) ESI-TOF MS spectrum (DMSO) of (C60)2@3b. (e) Optimized structures of molecular peanut (C60)2@3b (R=−H; ball-and-stick and space-filling models, the peripheral substituents are replaced by hydrogen atoms for clarity). (f) Ultraviolet–visible spectra and photographs (DMSO, room temperature) of (C60)2@3b, (C70)2@3b, (Sc3N@C80)2@3b and 2b.

