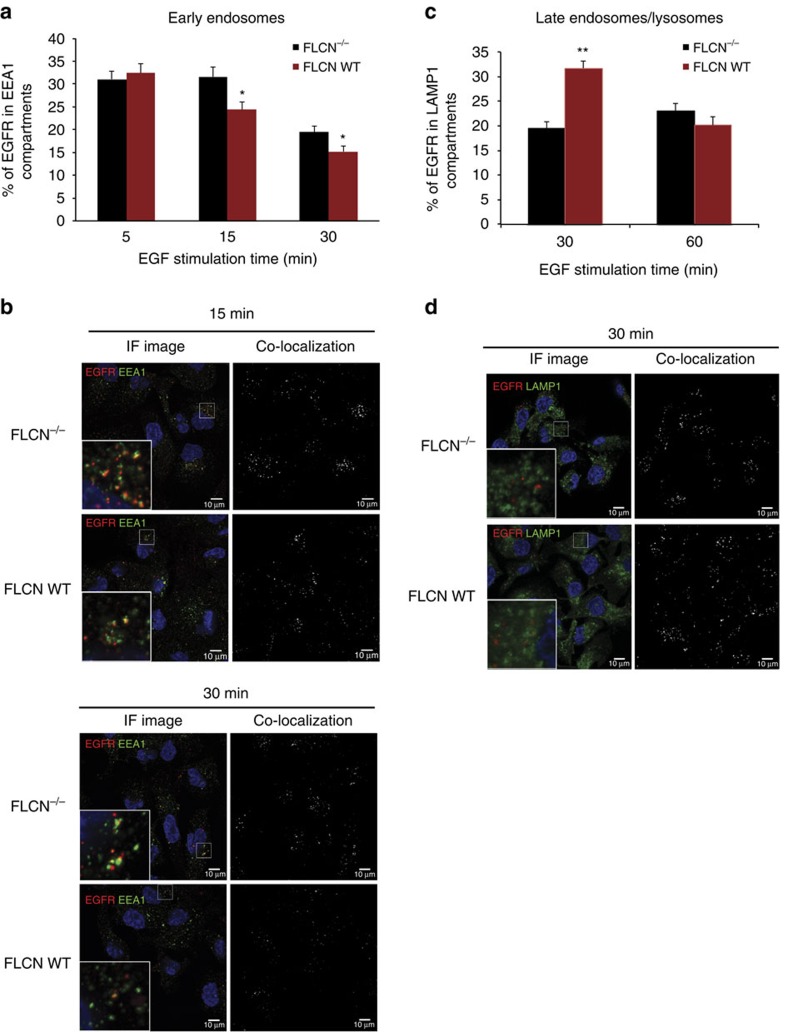
Figure 2. Loss of FLCN results in slower endocytic trafficking of EGFR.
(a) FLCN-deficient UOK257 cells (FLCN−/−) and wild-type FLCN-replete cells (FLCN WT) were starved for 2 h in RPMI 1640 (containing no growth factors and amino acids), then stimulated with EGF (1 μg ml−1), and fixed for immunofluorescence and confocal microscopy. The percentage of EGFR co-localizing with EEA1 for each time point was quantified from 18 pictures (5–10 cells/picture) taken from three independent experiments, and is presented as the mean±s.e.m. * indicates significance, t-test, P<0.05. (b) Squares on the left show confocal microscopy images of immunofluorescence with anti-FLCN and anti-EEA1 antibody (IF image). Squares on the right present the foci of co-localization as identified by ImageJ analysis (co-localization). Upper panel images were taken at 15 min and lower panel images taken at 30 min, as indicated. (c) FLCN-deficient UOK257 cells (FLCN−/−) and wild-type FLCN-replete cells (FLCN WT) were starved for 2 h in RPMI 1640 (containing no growth factors and amino acids) in the presence of chloroquine diphosphate salt (100 μM), then stimulated with EGF (1 μg ml−1), and fixed for immunofluorescence and confocal microscopy. The percentage of EGFR co-localizing with LAMP1 for each time point was quantified from 18 pictures taken from three independent experiments and is presented as the mean±s.e.m. ** indicates significance, t-test, P<0.0005. (d) Squares on the left show confocal microscopy images of immunofluorescence with anti-FLCN and anti-LAMP1 antibody (IF image). Squares on the right present the foci of co-localization as identified by ImageJ analysis (co-localization).

