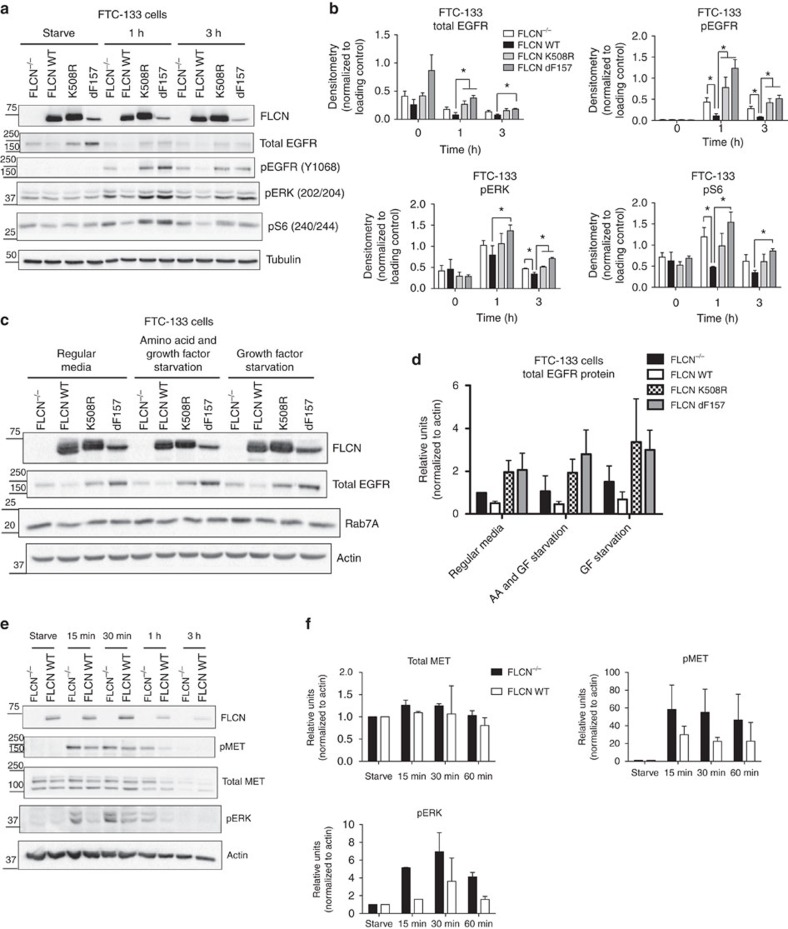
Figure 3. Ligand-dependent EGFR and MET signalling is increased in FLCN-deficient cells and cells expressing a tumour-associated FLCN mutant compared to FLCN-replete cells.
(a) FLCN-deficient FTC-133 cells (FLCN−/−) and isogenic cells replete with wild type FLCN (FLCN WT) or the tumour-associated mutants FLCN K508R and FLCN d157 were starved for 2.5 h and stimulated with 20 ng ml−1 of EGF for the indicated time points (1 or 3 h). A representative western blot demonstrating decreased phospho-EGFR (pEGFR), phospho-ERK (pERK) and phospho-S6 (pS6) signalling in FTC-133 FLCN WT-replete cells compared to FLCN-deficient or tumour-associated mutant cells is shown. (b) The densitometry of the bands in panel A was determined with BioRad Image Lab Software, and normalized to the loading control (either actin or tubulin). The data are presented as the mean±s.e.m., and * indicates statistical significance, one-tailed t-test, P<0.05. (c) FLCN-replete cells (FLCN WT) express less total EGFR compared to cells that are FLCN-deficient (FLCN−/−) or express a tumour-associated mutant form of FLCN (FLCN K508R and d157). FTC-133 cells were plated at the same density and grown asynchronously in regular media, or starved for either (1) 2.5 h in growth factor and amino-acid-depleted RPMI media, or (2) overnight in DMEM serum-free (SF) media. The expression of total EGFR and Rab7A was determined by western blot of cell lysates. (d) Bar graph depicting the densitometry of the western blot bands normalized to the actin loading control (densitometry was evaluated using BioRad Image Lab Software). The data presented are the means±s.d. from three independent experiments. (e) FLCN-deficient FTC-133 cells (FLCN−/−) and isogenic cells replete with wild-type FLCN (FLCN WT) were starved as in a and stimulated with 25 ng ml−1 of HGF for the indicated time points. A representative western blot demonstrating increased phospho-MET (pMET), and phospho-ERK (pERK) signalling in FLCN-deficient cells is shown. (f) The densitometry of the bands in e was determined with BioRad Image Lab Software, normalized to the loading control (actin), and expressed relative to starved samples. The data are presented as the mean±s.e.m.

