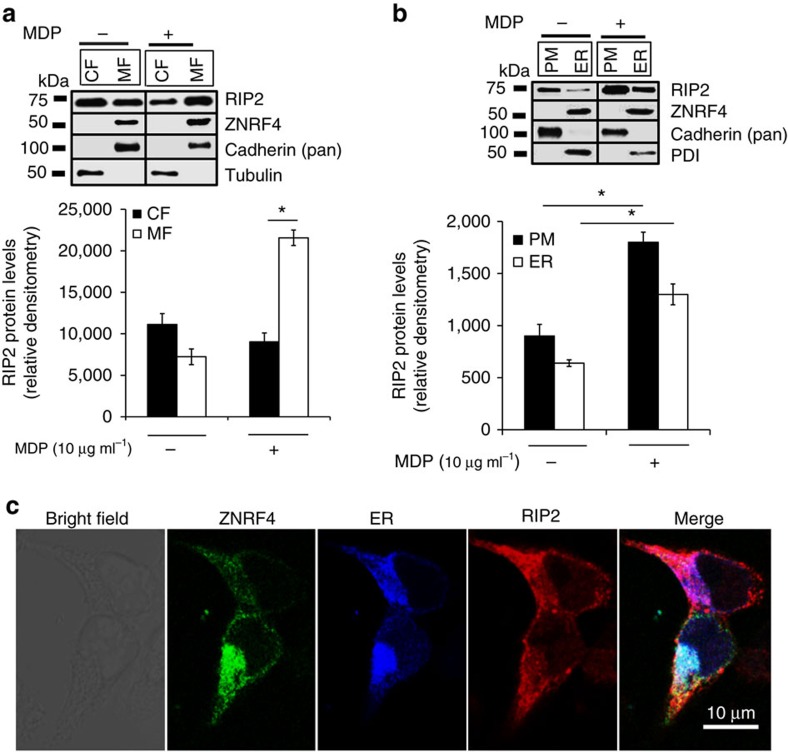
Figure 6. RIP2 colocalizes with ZNRF4 at the ER.
(a,b) Immunoblot analysis for RIP2 from various cellular fractions of HCT116 cells stimulated with MDP for 30 min. The cells were fractionated to separate (a) cytoplasmic (CF), membrane (MF) or (b) plasma membrane (PM), endoplasmic reticulum (ER) fractions, respectively. Equal amount of each fraction (30 μg) was analysed by western blot. Relative densitometric data (using ImageJ) of RIP2 levels in various fractions is shown in the bottom panels (n=3). (c) Confocal microscopy of HCT116 cells expressing RIP2-HA (red), YFP-ZNRF4 (green) and pmTurquoise2-ER (ER marker-blue). EV, vector control. Images were acquired at × 63 optical magnification. Scale bars, 10 μm. Western blots and confocal images are representative of one of three independent experiments that were conducted. *P<0.05. Significance was assessed using Student’s t-test. si-NT, non-targeting negative control siRNA. Protein disulfide isomerase (PDI)=marker for ER; cadherin (pan)=marker for PM.

