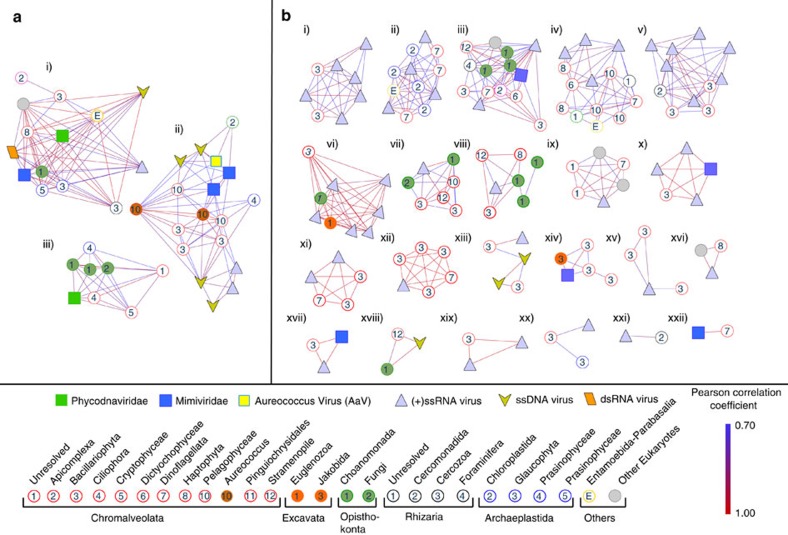
Figure 5. SIMPROF clustering of virus and eukaryotic markers from Quantuck Bay and Narragansett Bay study sites.
Statistically significant SIMPROF clusters containing both viral and eukaryotic members from (a) Quantuck Bay and (b) Narragansett Bay. Contigs are shown as nodes and the Pearson’s correlations as the connecting edges. Within the SIMPROF clusters, correlations only significant at the level of P≤0.1 are shown. Phylogenetic classifications of the contigs are shown in the bottom panel. A. anophagefferens (dark brown circles) and A. anophagefferens Virus (bright yellow square) are in cluster A(ii).

