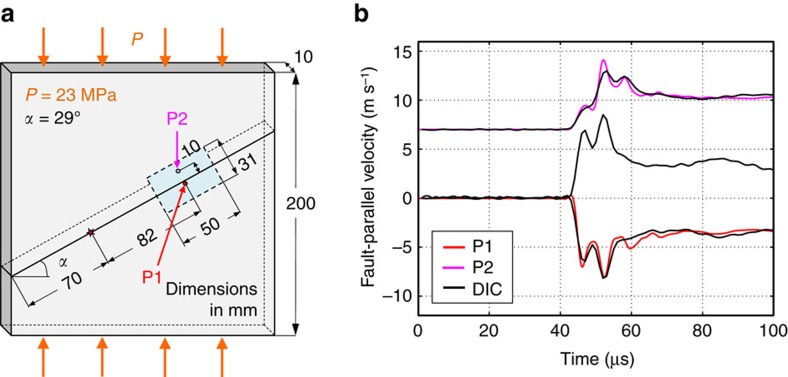
Figure 3. Validation of digital image correlation method with laser velocimeters.
(a) Schematics of the configuration employed for the comparison of the full-field imaging method to the laser velocimeter technique. The field of view (blue rectangle, 50 × 31 mm2) and the location of the velocimeter measurements (P1 and P2) are indicated. (b) Fault-parallel velocity time-histories measured with laser velocimeters (colored curves) and with the full-field DIC technique (black curves). The curve corresponding to the velocimeter location P2 is shifted upwards by 7 m s−1 for clarity. Note the excellent agreement of the two measurements. The two black curves based on the full-field technique from above and below the interface show a near-perfect anti-symmetric signal, consistent with in-plane shear rupture.

