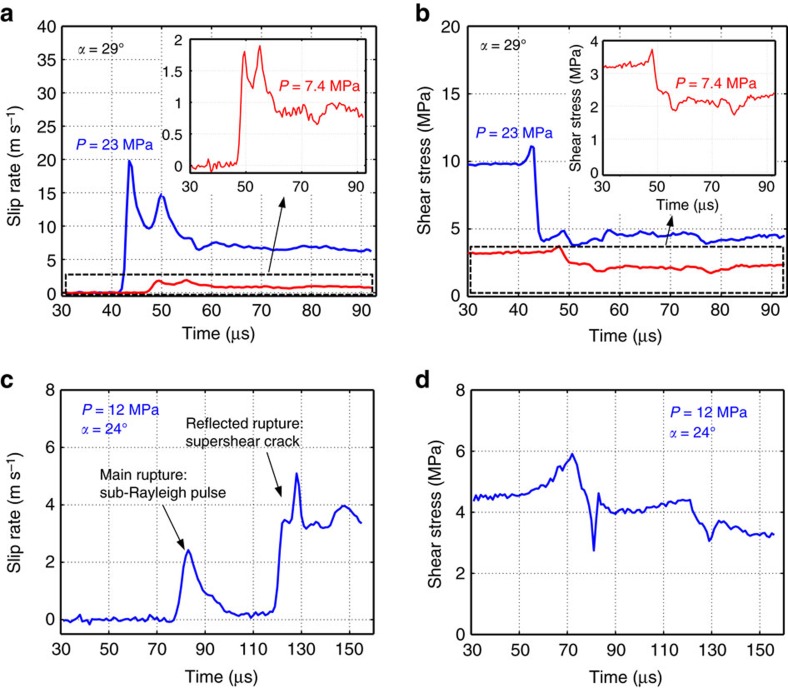
Figure 4. Monitoring the laboratory earthquake vitals.
(a) Slip rate and (b) shear stress time histories obtained on the interface at the center of the field of view shown in Fig. 1 for two far field loads, P=23 MPa (blue) and P=7.4 MPa (red), and angle α=29°; both cases result in supershear ruptures. Insets: Magnified slip rate and shear stress time histories for the case P=7.4 MPa. The rupture produced by the higher far-field load has an order of magnitude higher peak slip rate and a more prominent reduction in shear stress compared to the lower load case. Yet the two ruptures are qualitatively similar as demonstrated by the insets. (c) Slip rate and (d) shear stress time histories for P=12 MPa and α=24°. This experiment has a very different slip-rate history, with a sub-Rayleigh pulse-like rupture propagating first, followed by a reflected supershear crack-like rupture.

