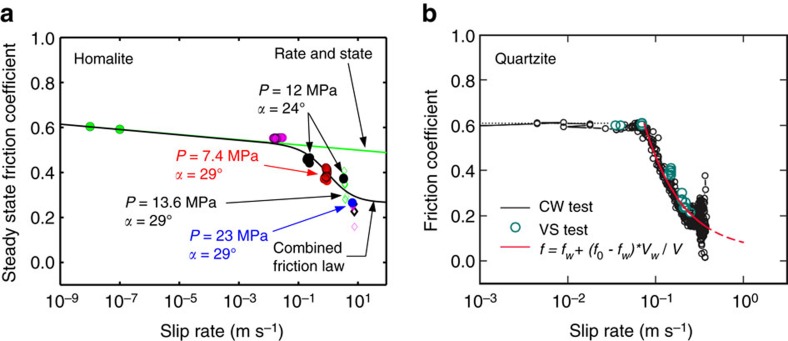
Figure 8. Steady-state friction versus slip rate.
(a) Experimental measurements of steady-state friction coefficient versus slip rate and fits with the standard rate-and-state friction formulation (green curve), and combined formulation of rate-and-state friction enhanced by flash heating (black curve). Our steady-state measurements are consistent with the combined formulation. Green dots are low-velocity measurements obtained in collaboration with Kilgore, Beeler, and Lu and reported in Lu39. Red, blue, black and purple solid symbols are measurements obtained with the smallest field of view used in this study (18 × 11.2 mm2) and hence the highest level of accuracy. The green, black and purple empty diamonds are measurements with larger fields of view (up to 145 × 91 mm2) and lower levels of accuracy. (b) Experimental measurements of dynamic friction on quartzite samples22, showing similar behaviour for rocks, with significant slip-rate dependence of friction for high steady-state slip rates, consistent with the flash heating formulation. Note the different horizontal scale for the two plots.

