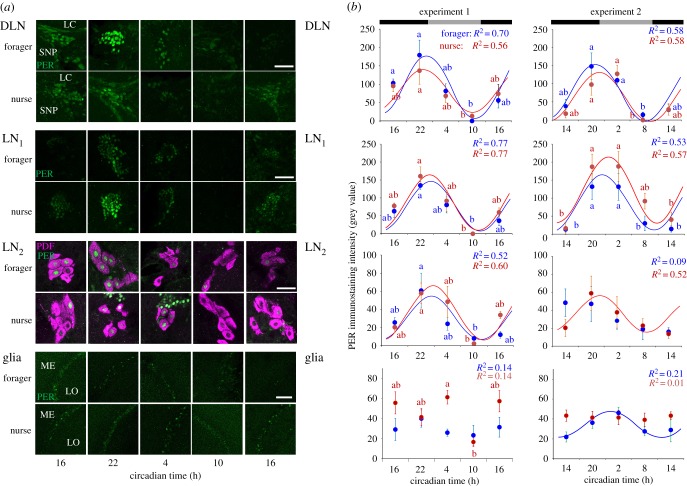
Figure 7.
Oscillations in amPER immunostaining intensity in neuronal clusters and glial cells in foragers and nurses sampled around-the-clock. (a) Representative microphotos of vibratome-sectioned brains double-stained with anti-amPER (green) and anti-PDF (magenta) antibodies. Cell cluster names are as described in figure 3a. Samples were collected every 6 h for a total of five time points. Scale bars, 20 µm. (b) Mean immunostaining intensity ± s.e.m., and fitted cosine model curves for Trial 1 (left, n = 4 brains/time point) and Trial 2 (right, n = 6). Values for nurses are depicted in red, and for foragers in blue. For each curve the calculated colour coded R2 from regression with a cosine model is indicated in the upper right corner. Statistically significant (p < 0.05) cosine models are depicted by a continuous line. Time points with different small letters are significantly different in Kruskal–Wallis and Nemenyi post hoc test (p < 0.05). Pictures are taken with a 40× objective; distance of z-stacks 1.0.

