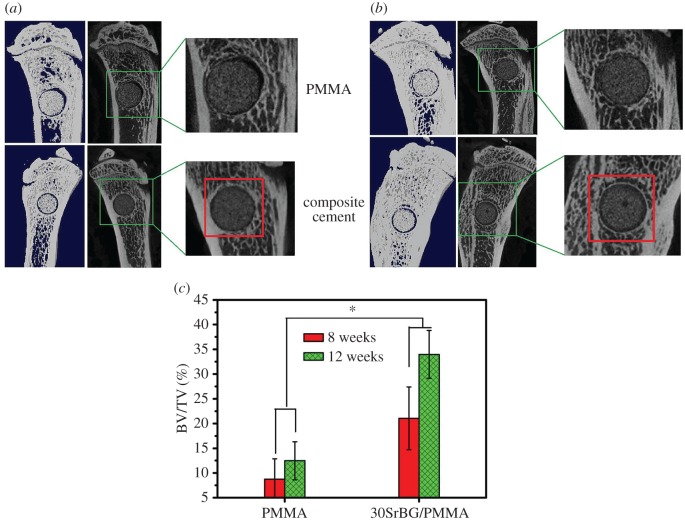
Figure 12.
Micro-CT evaluation of bone regeneration in the rat tibia defects with implantation of PMMA cement and 30 SrBG/PMMA composite cement for (a) eight and (b) 12 weeks. Three-dimensional reconstructed images and sagittal images by micro-CT imaging of the area surrounding the cement implants, showing newly formed bone around the interface between the cement implant and host bone for (a) eight and (b) 12 weeks (area outlined in red); (c) bone volume/total volume (BV/TV) in the defects implanted with 30SrBG/PMMA composite cement with different post-implantation times. Values are presented as mean±s.d.; n = 3. *Significant difference between groups (p < 0.05). (Online version in colour.)

