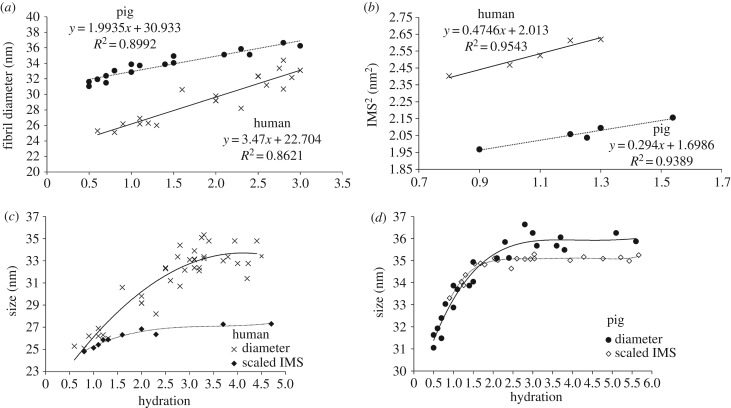
Figure 7.
Fibril diameter data (from figure 4) and intermolecular spacing2 (IMS2) are shown at low hydrations, where the behaviour is linear. Intermolecular spacings are normalized to match the value of the corresponding fibril diameter at H = 0 for human (c) and pig (d) corneas, based upon the assumption that the thickness of the GAG coating is negligible when the fibrils are dry. A best-fit polynomial has been applied to each dataset.

