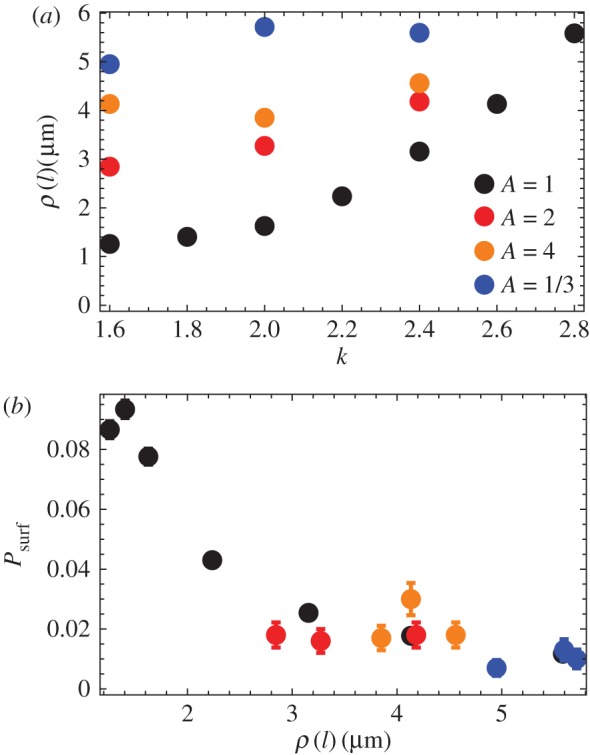
Figure 12.

(a) Local roughness ρ(l) as the function of k, for different levels of friction anisotropy: no anisotropy (black points, A = 1), ‘rolling rods’ A = 2 (red), A = 4 (orange) and ‘sliding rods’ A = 1/3 (blue). (b) Surfing probability versus local roughness ρ(l) for the same parameters as in panel (a). In all cases, L = 320 and l = 80 μm. (Online version in colour.)
