Figure 15.
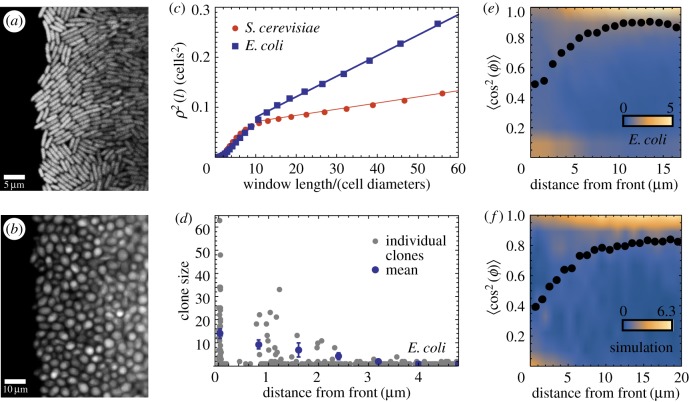
Microscopic properties of the growing layer. (a,b) Snapshot of an E. coli front (a, scale bar 5 μm) and an S. cerevisiae front (b, scale bar 10 μm) front. (c) Local roughness squared ρ2(l) as a function of the window size l. Dashed lines are fits to the data points. (d) The number of offspring for all initial cells near the front, for E. coli. Only cells within 2–3 μm (approx. one cell) from the edge of the colony have a significant number of offspring. (e) Probability density P(S) of the order parameter S = 〈cos2ϕ〉 for E. coli as a function of the distance from the edge. Blue, low probability; yellow, high probability (cf. the scale bar). P(S) has been normalized so that . The dotted line is the average order parameter versus the distance from the front. Cells are preferentially aligned with the direction of propagation, except for cells directly at the front, which are parallel to it. (f) Density plot of the order parameter for a simulated front with k = 1.4, L = 320 μm. (Online version in colour.)

