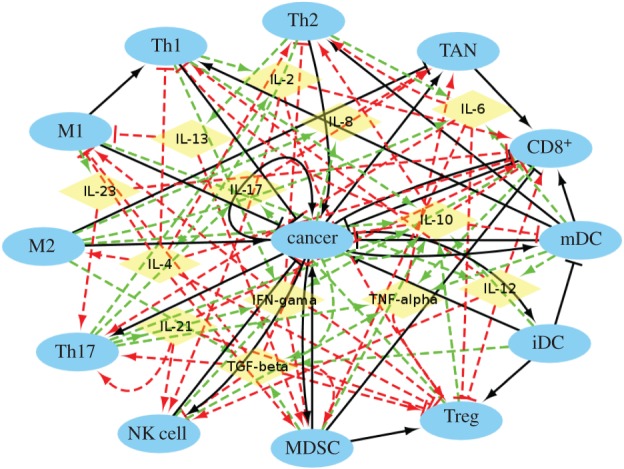
Figure 1.

The cancer–immune system. The network includes 26 nodes and 107 interaction links. Cerulean ellipses represent cells and yellow diamonds represent cytokines. Black solid arrows and bars represent cell–cell activation and inhibition, respectively. Red dashed arrows and bars represent cytokine–cell activation and inhibition, respectively. Green dashed arrows represent cell–cytokine production.
