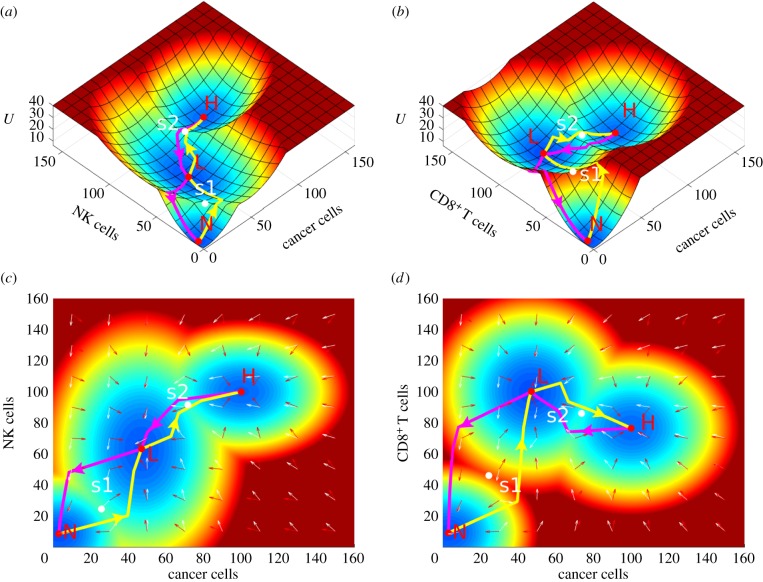
Figure 3.
The landscape of the cancer innate immune and adaptive immune system. The cancer innate immune system is depicted by cancer cells and NK cells in (a,c). The cancer adaptive immune system is depicted by cancer cells and CD8+ in (b,d). N, normal state; L, low cancer state; H, high cancer state; s1, saddle between the normal state and the low cancer state; s2, saddle between the normal state and the high cancer state. The yellow arrows represent the paths from N to L and from L to H, and the magenta arrows represent the paths from H to L and from L to N. The white arrows represent the directions of probability flux, and the red arrows represent the directions of the negative gradient of potential energy. (c,d) Same landscape in two dimensions for (a,b), respectively.

