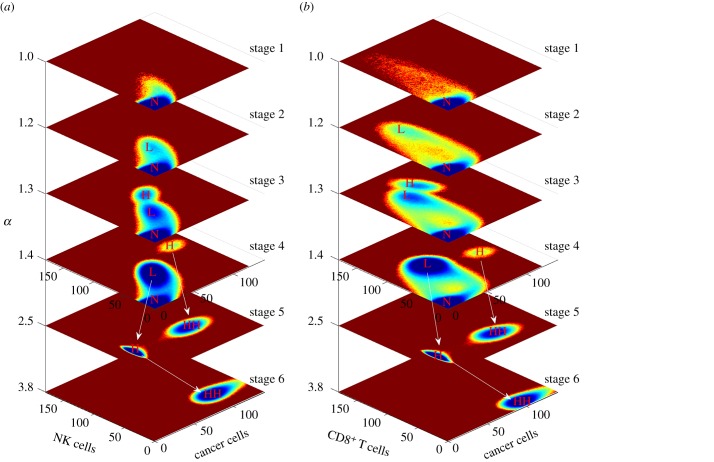
Figure 6.
Dynamic landscape of cancer tumorigenesis and development. The horizontal coordinates represent cancer development along with increasing α from top to bottom. The top four stages and the bottom two stages are shown in different ranges of cancer cell concentration level. The cancer cell concentration in the bottom two stages ranges from 0 to 1400. The cancer cell concentration in the top four stages ranges from 0 to 140. The white arrows indicate the state moves between two stages: (a) dynamic landscape for cancer cells and NK cells and (b) dynamic landscape for cancer cells and CD8+.

