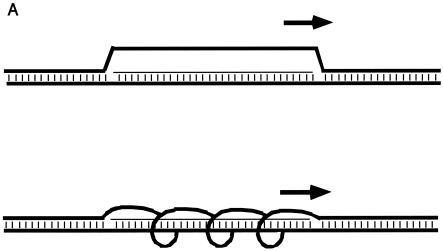
FIG. 1.
Two- and three-dimensional representations of R-loops. (A) Two-dimensional diagrams of R-loops. The thick horizontal lines represent each of the two DNA strands. The thin horizontal line represents the RNA transcript. Vertical dashes indicate base pairing. The short thick arrow above the R-loop indicates the position and direction of the RNA polymerase that is generating the RNA. The upper diagram shows the displaced strand with maximal displacement from the RNA-DNA duplex but with zero twist relative to the RNA-DNA duplex. The lower diagram illustrates the displaced DNA strand with shorter distance of displacement from the RNA-DNA duplex and with some twist relative to the RNA-DNA duplex. (B) Three-dimensional model of an R-loop. One switch repeat is shown configured as an R-loop. On the left, the structure is viewed from one end, with the RNA-DNA duplex (A-form) in the center and the displaced nontemplate strand (green) on the perimeter. On the right, a longitudinal view is shown. The template strand loses two helical turns (720°) as it unwinds and extends away from the RNA-DNA duplex, with a maximum displacement of 21 Å from the duplex. For comparison, a globular 24-kDa protein (the size of an AID monomer) would have a radius of approximately 50 Å. Green, nontemplate strand (displaced R-loop); red, template strand; blue, RNA; yellow, cytosine bases in the R-loop.


