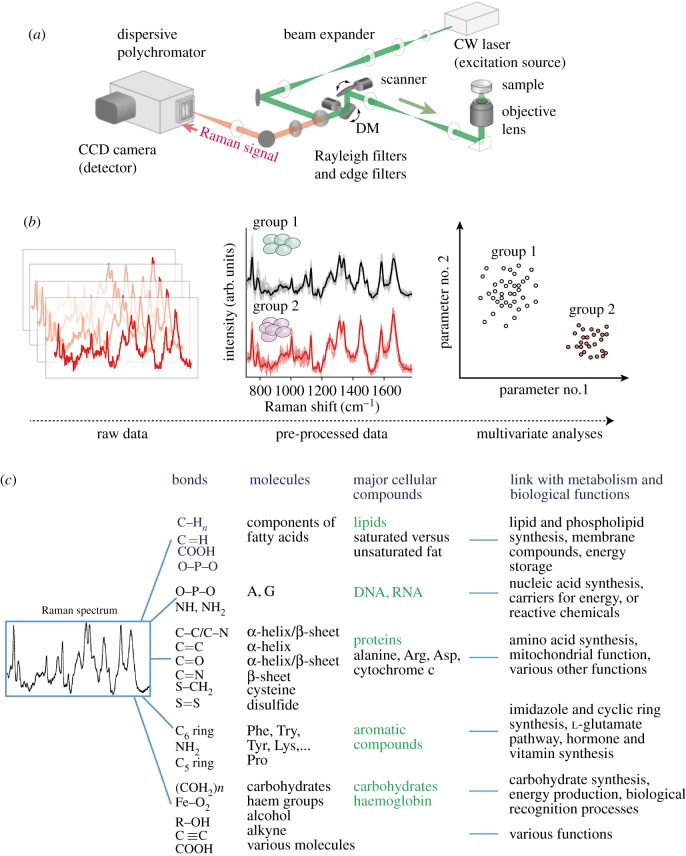
Figure 1.
A general overview of Raman spectroscopy. (a) A generalized overview of the optical set-up for a typical spontaneous Raman spectroscopic microscope. A monochromatic laser light illuminates the sample, emitting Raman scattering light. A small portion of this scattering passes through the objective lens and goes through the optical pathway to the dispersive polychromator (i.e. spectrophotometer), where it is captured by a CCD detector. (b) Raw spectral data must be processed through various procedures to improve the quality of the signal by removing noise (e.g. due to cosmic rays, the auto-fluorescence signal of the samples or from unavoidable technical variations). Because spectra are not always useful to visualize and are characterized by the molecular composition between each group or conditions, they are usually used as the input for multi-variate analyses such as principal component analyses, projection latent structure analyses, discriminant analyses and support vector machines, which are particularly powerful for identifying and discriminating individuals from the contribution of all or specific Raman wavelengths. (c) Representation of the inherent layers that contribute to the complex spectral signature.

