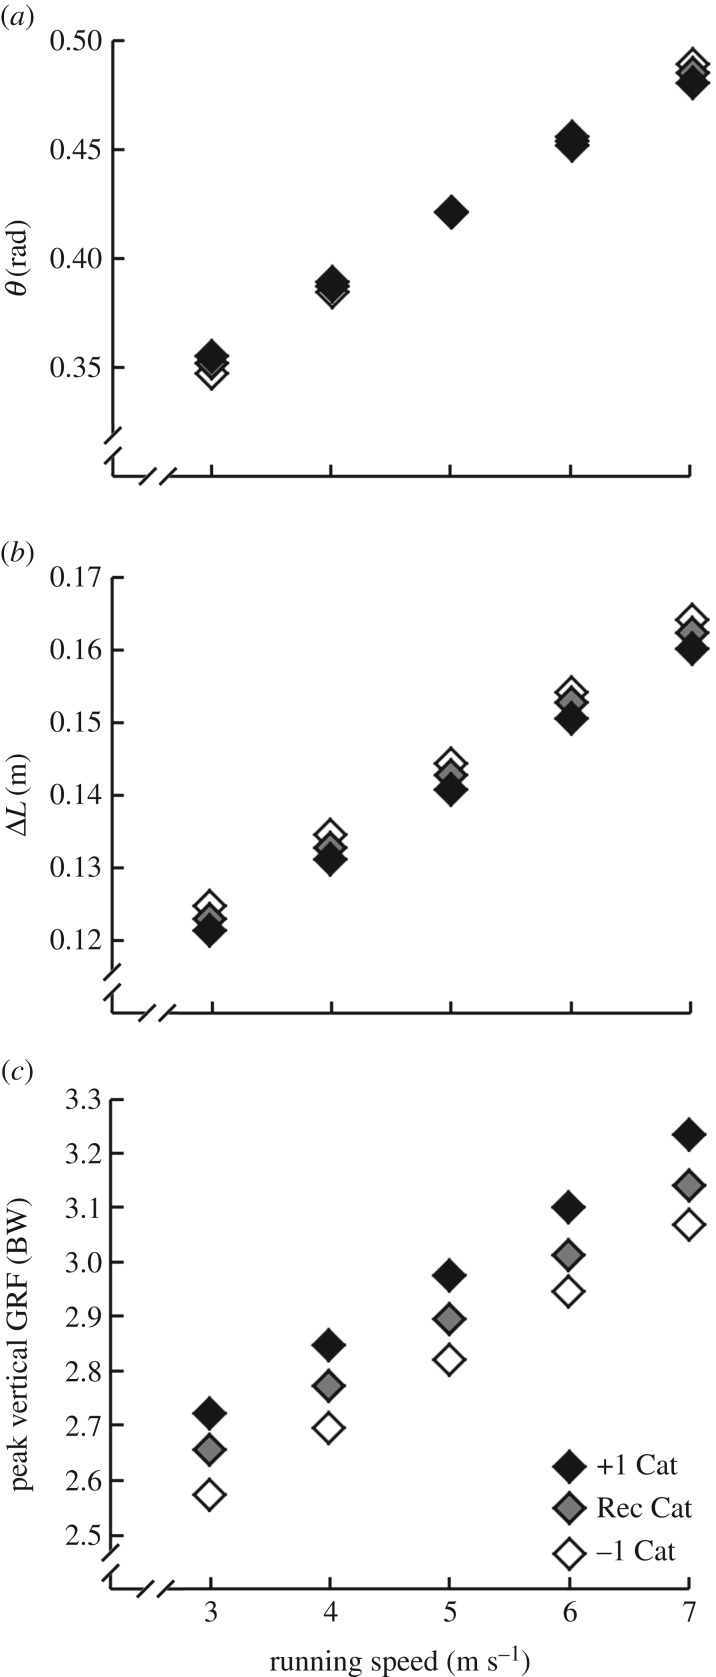
Figure 5.
(a) Touch-down angle (θ), (b) leg spring compression (ΔL) and (c) peak vertical GRF averaged from three different running-specific prosthetic models at one stiffness category below recommended (−1 Cat), at recommended (Rec Cat) and at one stiffness category greater than recommended (+1 Cat) across running speeds. Prosthetic stiffness categories correspond to a 70 kg athlete. See table 2 for prosthetic stiffness values (kRSP in kN m−1) used at each speed (v) and stiffness category recommendation. Biomechanical data are derived from statistical linear mixed models. The regression equations follow as: (a) θ = 0.055 v + 0.004 kRSP − 0.001 Speed · kRSP + 0.145; (b) ΔL = 0.010 v − 0.001 kRSP + 0.109; (c) peak vertical GRF = 0.10 v + 0.03 kRSP + 1.59.

