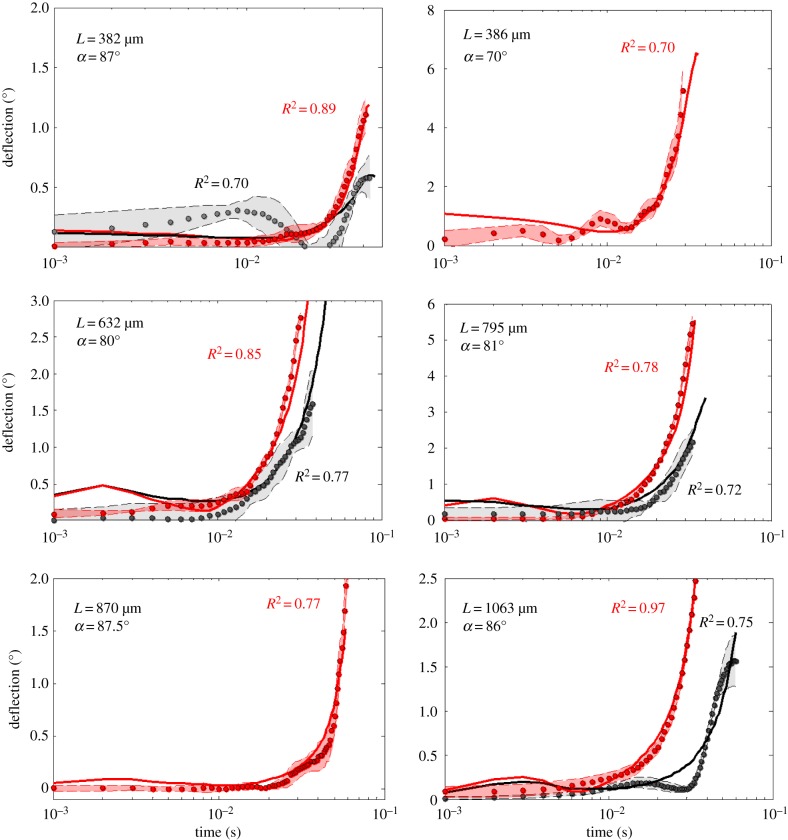
Figure 7.
Comparing hair deflection measurement and model prediction. The points represent the measurements of deflection for six isolated hairs (L = 382, 386, 632, 795, 870 and 1063 μm), and the thick red and black lines represent the model prediction of hair deflection. The grey points represent the average deflection time for a hair of the given length in response to the flow produced by the piston approaching at 30 cm s−1. The thin black lines and the grey area represent the standard deviation. The red points represent the mean deflection for the same hair subjected to the flow produced by a piston approaching at 58 cm s−1. The thin red lines and the red area represent the standard deviation.

