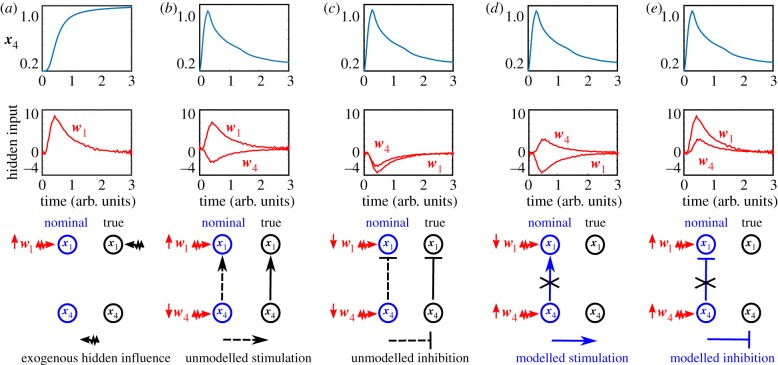
Figure 3.
Illustration of hidden exogenous and endogenous influences by an arbitrary example system. (a) Hidden exogenous influence. No significant temporal correlation between x4 and w1 is expected. (b) Hidden endogenous influence as a missing stimulatory interaction (arrow) from x4 to x1. Here, hidden influences w4 and w1 are highly negatively correlated. This is caused by a missing stimulating effect of x4 on x1. The decrease of x4 is correlated with an increase of w1. (c) Hidden endogenous influence as a missing inhibitory interaction. Here, hidden influences w4 and w1 have a strong positive correlation and compensate a missing inhibitory effect of x4 on x1. The increase of x4 is correlated with an decrease of w1. (d) Hidden endogenous influence as erroneous stimulation. Here, hidden influences w4 and w1 have a strong negative correlation. The increase of x4 goes along with a decrease of w1. (e) Hidden endogenous influence as an erroneous inhibition. The hidden influences w1 and w4 are concordant and correlate strongly with the state component x4.

