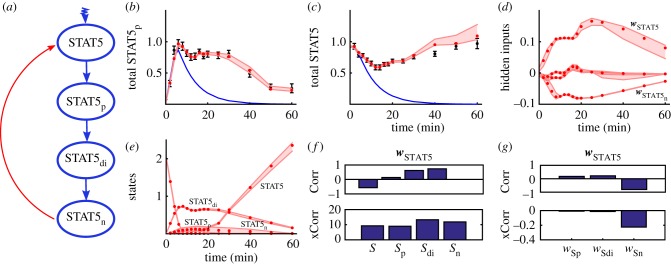
Figure 4.
Reconstructing the model error for the JAK–STAT signalling pathway [19]. (a) Nominal model of the JAK–STAT signalling (blue) including its nucleocytoplasmic cycling (red). (b,c) Measurements (black) for phosphorylated cytoplasmic STAT5 and total cytoplasmic STAT5 and posterior BDEN predictions including the 95% credible intervals (red) based on the nominal system (blue). (d) Estimated hidden inputs (posterior means) and 95% credible intervals. There is a clear input located at STAT5 and STAT5 in the nucleus. (e) Estimated time series posterior means for all modelled variables including 95% credible intervals. (f) Estimated correlations (Corr) and cross-correlations (xCorr) of the estimated hidden input  located at STAT5 with all estimated state variables. (g) Estimated correlations and cross-correlations of
  with all remaining hidden influences. Here
  is clearly correlated to the hidden input located at STAT5n and in addition it is correlated to the time series of STAT5n. High cross-correlation is a necessary but not sufficient condition.

