Figure 5.
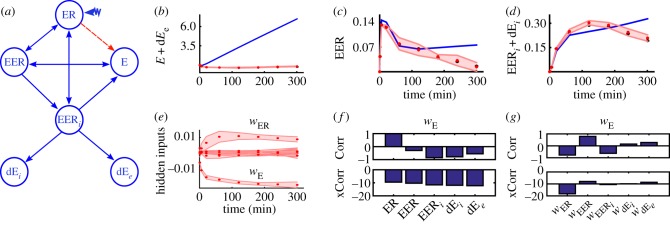
Reconstructing the hidden influence in a model of the EpoR regulation [37]. (a) Reaction graph of the model (E = Epo, ER = EpoR, EER = Epo − EpoR, EERi = Epo − EpoRi, dEi = dEpoi, dEe = dEpoe). The red arrow is a wrong reaction. (b,c,d) Output measurements (black) compared with posterior BDEN predictions (red) including 95% credible intervals and the nominal model (blue). (e) Estimates of the hidden influences (posterior mean) including 95% credible intervals. (f) Estimated correlations (Corr) and cross-correlations (xCorr) of the hidden influence related to wE with all estimated state variables. A clear correlation with EpoR is observable. (g) Estimated correlations (Corr) and cross-correlations (xCorr) of the hidden influence related to wE with all estimated remaining hidden influences. Again wE is clearly correlated with wER. In consequence, the direct interaction between ER and E is correctly classified as wrong and has to be removed.

