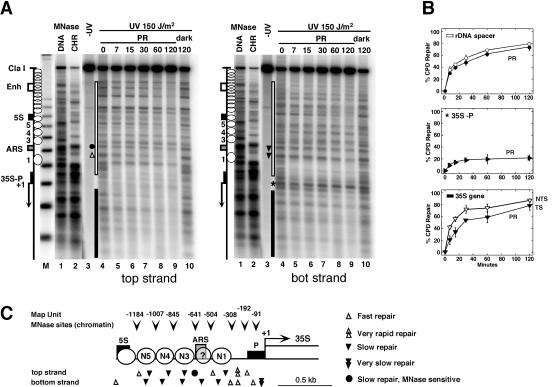
FIG. 2.
Chromatin structure modulates UV damage formation and repair in the rRNA gene spacer. (A) Chromatin footprinting by micrococcal nuclease (MNase) was compared with CPD repair by photolyase in AMY3 (rad1Δ). Cells were irradiated with UV light (150 J/m2) and exposed to photoreactivating light (PR). DNA was purified, digested with ClaI and NdeI, and cut at CPDs with T4-endoV. Chromatin (CHR) and genomic DNA (DNA) were isolated from UCC510, partially digested with micrococcal nuclease (MNase), and cut with ClaI and NdeI. The DNA was fractionated on alkaline agarose gels and blotted and hybridized with probes for the bottom strand (right panel) and top strand (left panel), respectively. The positions of the DNA elements (as described for Fig. 1A), positioned nucleosomes (white circles), and nucleosomes not positioned (overlapping circles) are indicated. M, a size marker with multiples of 256 bp; lanes 1, DNA digested with MNase; lanes 2, chromatin digested with MNase; lanes 3, DNA of unirradiated cells; lanes 4, DNA of irradiated cells with no repair (initial damage); lanes 5 to 9, DNA of cells after incubation in photoreactivating light for 7 to 120 min; lanes 10, DNA of cells after incubation in the dark for 120 min. Sites of differential repair in the ARS region (dot, triangles) and in the promoter (star) are indicated. (B) Repair curves of the whole spacer region (white bar in panel A), the promoter region (35S-P; star in panel A), and the transcribed region (black bar in panel A). Black symbols, bottom stand; white symbols, top strand. The bottom strand is the transcribed strand (TS); the top strand is the nontranscribed strands (NTS) of the 35S gene. Data are given as averages with standard deviations for at least three gels. The modulation of repair in the spacer, promoter, and coding region was reproduced in duplicate experiments. Strand-specific repair in the coding region confirmed previous observations (30). (C) Schematic summary and structural interpretation of DNA accessibility to MNase (arrowheads) and photolyase (triangles). Circles 1, 3, 4, and 5 represent positions of nucleosomes. Whether ARS is included in a nucleosome is unclear (circled question mark; see text).

