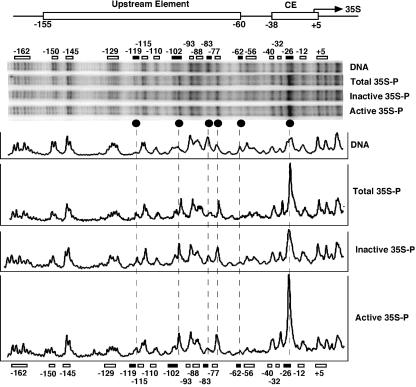
FIG. 5.
UV photofootprints in active and inactive promoters. DNA was irradiated with 80 J/m2. AMY3 (rad1Δ) cells were irradiated with 150 J/m2. Active and inactive 35S promoters were isolated as described for Fig. 3. Pyrimidine dimers were detected by primer extension as described for Fig. 4. Pyrimidine dimer distribution in irradiated naked DNA (DNA), in total DNA of irradiated cells (Total 35S-P), and in purified fragments containing active and inactive promoters (Inactive 35S-P; Active 35S-P) are shown. A comparison of relative pyrimidine dimer yields is shown (PhosphorImager scans). Symbols are as defined for Fig. 4C.

