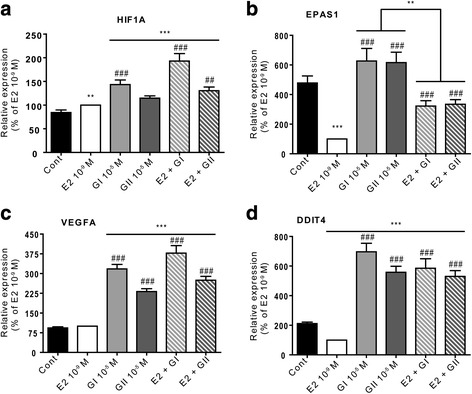
Fig. 7.

Validation of differentially expressed genes corresponding to the HIF1α/EPAS1 community. MCF-7 cells were treated with vehicle (black), 10−9 M E2 (white), 10−5 M glyceollin I (light grey) and II (hard grey), or a combination of E2 and each of the glyceollins (hatched squares). The relative expression of HIF1α (a), EPAS1 (b), VEGFA (c) and DDIT4 (d) was assessed by real-time PCR and normalized to the expression of the housekeeping genes GAPDH and TBP. The results are expressed as the percentage of relative expression of each transcript obtained in E2-treated cells and are represented as the mean +/− SEM of 10 independent experiments. **p-value <0.01 and ***p-value <0.001 with a Mann-Whitney test followed by Bonferroni correction for comparisons of the control vs the treatments. ##p-value <0.01 and ###p-value <0.001 with a Mann-Whitney test followed by Bonferroni correction for comparisons of E2 vs the other treatments
