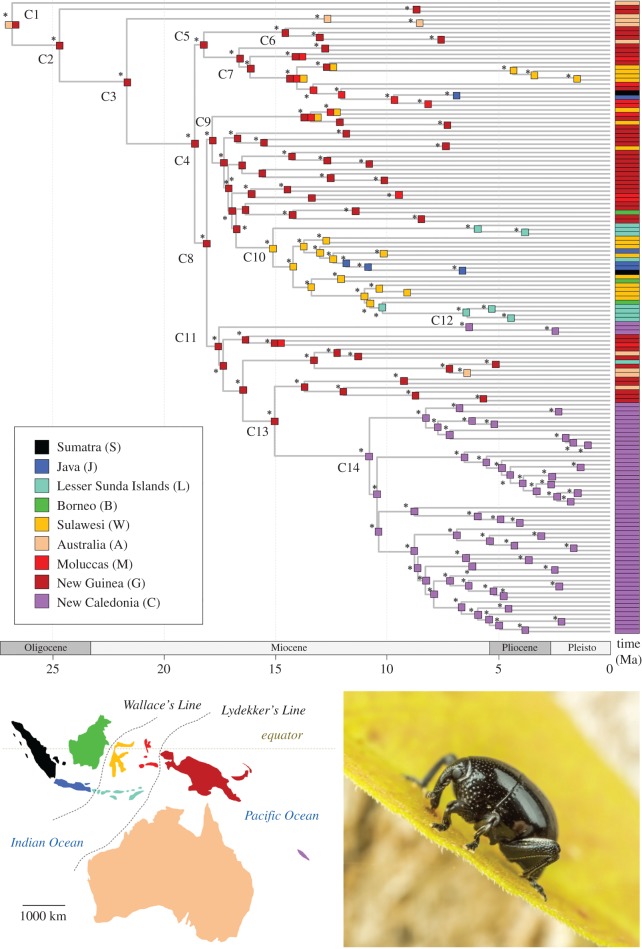
Figure 3.
Palaeobiogeography of New Caledonian Trigonopterus. BEAST chronogram presenting median age estimates for the Trigonopterus radiation (see electronic supplementary material, appendix S4 for the full chronogram with CI bars). The main clades are labelled as in figure 2 and their age estimates are detailed in table 1. For each species used in this study, the distribution as defined in the BioGeoBEARS analyses is given at the corresponding tip. The colours are coded following the map inserted at the bottom left corner of the figure and as indicated in the caption. The ancestral range estimation recovered in the preferred BioGeoBEARS analyses (DIVALIKE + j) is presented for every node of the phylogeny. Asterisks indicate that the estimated best ancestral range had more than 50% relative probability compared with other possible ancestral ranges (see electronic supplementary material, appendix S6 for more details). The photograph inserted at the bottom right corner highlights a specimen of Trigonopterus in natura (Queensland, Australia, Photo D. Yarrow).

