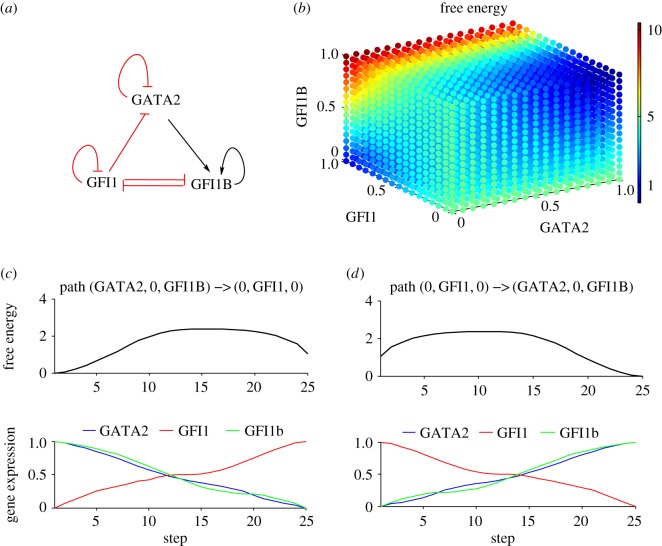
Figure 3.
The GATA2-GFI1-GFI1B network and the corresponding free energy and shortest paths between the attractors. (a) The corresponding circuit with the GFI1B and GFI1 mutual inhibition, GFI1 repressing GATA2 and GATA2 inducing GFI1B. GATA2 and GFI1 self-interact negatively while GFI1B is characterized by positive auto-regulation. (b) The free energy exhibits two attractors: (1) GATA2/GFI1B-high and GFI1-low and (2) GFI1-high and GATA2/GFI1B-low, respectively. The corresponding equations together with parameter values are found in the electronic supplementary material, S1. (c) Variation of the free energy and gene expressions along the shortest path between (1) and (2). (d) The corresponding variation along the shortest path between (2) and (1).

