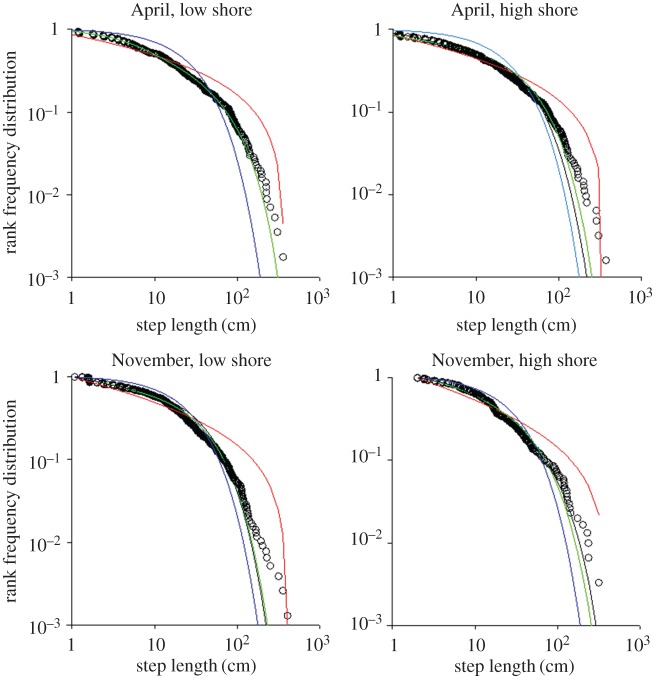
Figure 3.
Movement patterns of P. vulgata at Menai Bridge, UK. Rank frequency plot of the tested model step-length distributions (exponential, blue; bi-exponential, black; three-mode Weierstrassian Lévy walk, green; and power law, red) and empirical data recorded (open circles) in April and November and different zones (high shore and low shore) of the cliff where the home scar was located. For the November, high shore case the minimum step length was 2 cm rather than 1 cm because there were no steps shorter than 1.5 cm.

