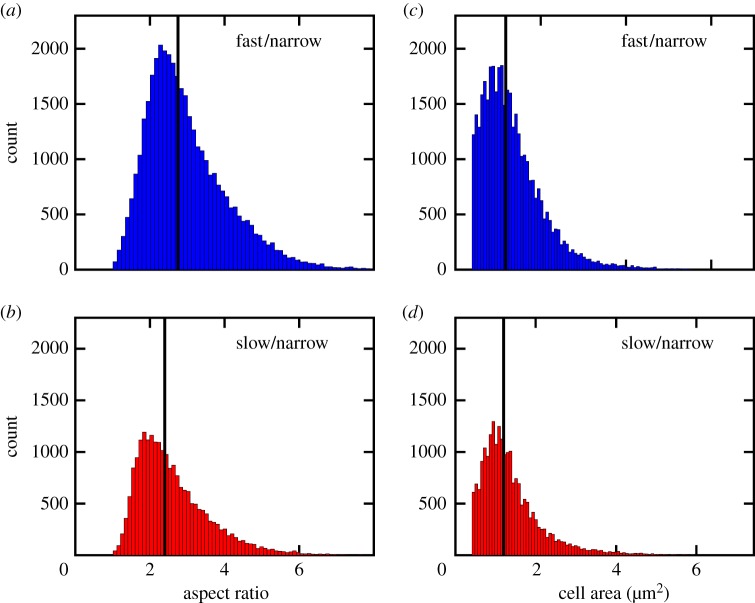
Figure 4.
Reducing the growth rate reduces the cell aspect ratio and narrows the distribution in cell area. The figures show distributions of aspect ratio (a,b) and cell size (c,d) in narrow slits (15 μm wide) for fast growth (LB, (a,c)) and slow growth (M9+0.2%CAA, (b,d)). The black lines indicate the medians in the distributions: aspect ratio—fast/narrow: 2.8; slow/narrow: 2.4. Cell area—fast/narrow: 1.3 μm2; slow/narrow: 1.2 μm2.

