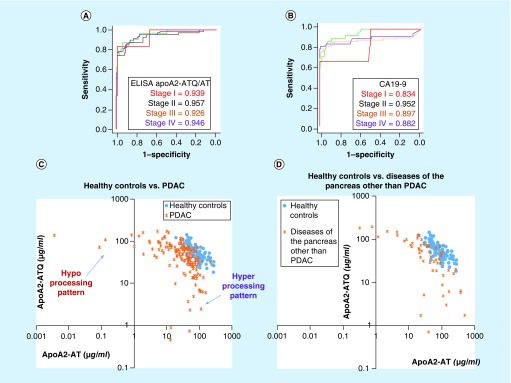
Figure 3. . ROC and AUC values of apoA2-ATQ/AT and CA19–9.
2D scatter graph of apoA2-ATQ/ATQ and apoA2-AT/AT in the multi-institutions study. (A & B) ROC curves and AUC values of apoA2 and CA19–9 to distinguish patients with PDAC from healthy controls. The patients with PDAC were classified into clinical stages according to the Union for International Cancer Control (red line, stage I; green line, stage II, orange line, stage III and purple line, stage IV) [36].(C & D) 2D scatter graphs of apoA2-ATQ/ATQ (y-axis) and apoA2-AT/AT (x-axis) in PDAC (orange letter Xs) versus healthy controls (blue circles) (C) and diseases of the pancreas other than PDAC (orange letter Xs) versus healthy controls (blue circles) (D). The representative hyper- or hypo-processing pattern was recognized in PDAC and risk diseases of pancreatic cancer [ 36].
PDAC: Pancreatic ductal adenocarcinoma; ROC: Receiver-operating characteristic.

