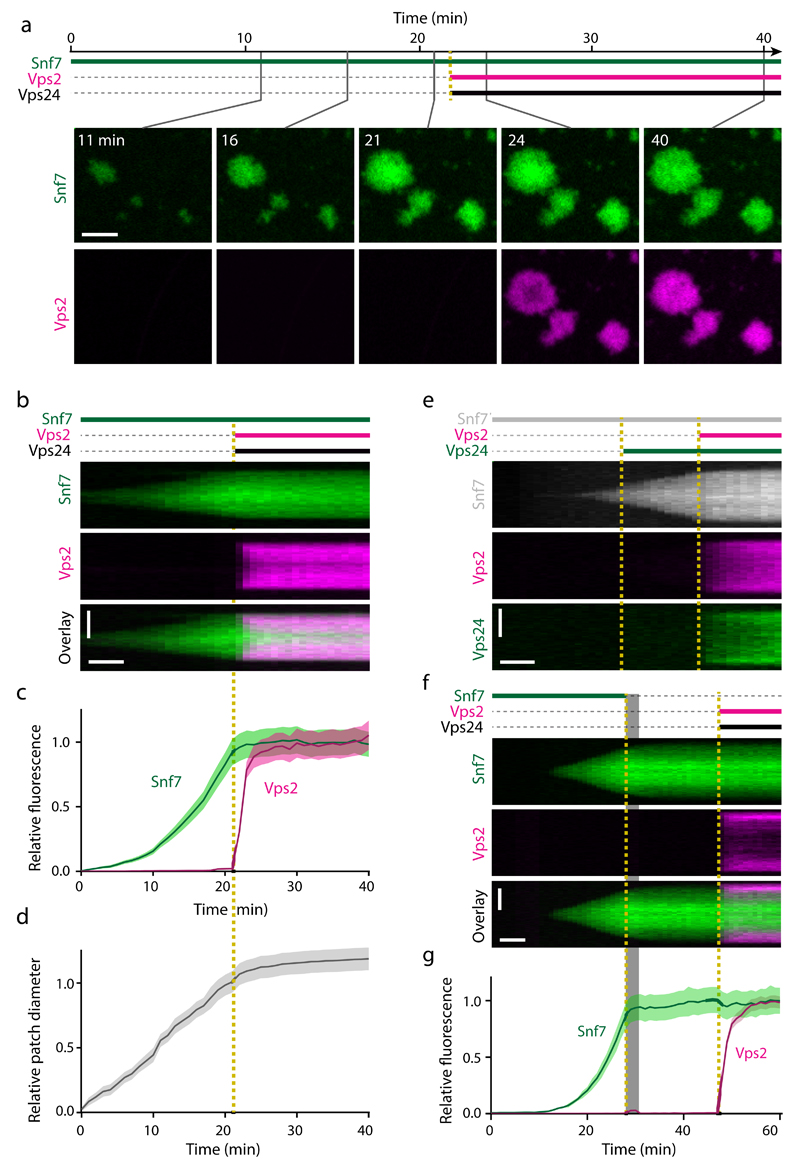
Figure 4. Vps2 and Vps24 cooperatively bind Snf7 patches and inhibit ESCRT-III polymerization.
(a) Time-lapse microscopy of ESCRT-III polymerization on supported lipid membranes in a microfluidic flow chamber. Recombinant Snf7-AlexaFluor-488 was injected at t = 0 min; Vps2-Atto-565 and Vps24 were added at t = 22 min. (b) Kymograph of a single ESCRT-III patch from a. (c-d) Quantification of (c) mean fluorescence and (d) patch diameters from 24 patches as in a-b (quantified from 4 fields of view within a representative experiment, and consistent results in 3 independent experiments using differently labeled proteins, e.g. Supplementary Fig. 6a-c). Curves and shaded areas represent mean ± SEM. (e) Kymograph of an experiment where Snf7-AlexaFluor-647N was added at t = 0 min, followed by sequential addition of Vps24-AlexaFluor-488 and Vps2-Atto-565 (representative image from 24 patches within the shown experiment, and 1 additional independent experiment). (f) Kymograph of an ESCRT-III patch, where Snf7-AlexaFluor-488 was added at t = 0 min, then washed out during 28-32 min (shaded area), followed by addition of Vps2-Atto-565 and Vps24 at t = 47 min. The transient increase of Vps2 signal during washout resulted from background ambient light. (g) Fluorescence quantification of 37 patches as in f (analyzed from 4 fields of view within the shown experiment, and 3 additional independent experiments). Curves and shaded areas represent mean ± SEM. Scale bars, 5 μm in a; 5 µm (vertical) and 5 min (horizontal) in b, e, f.

