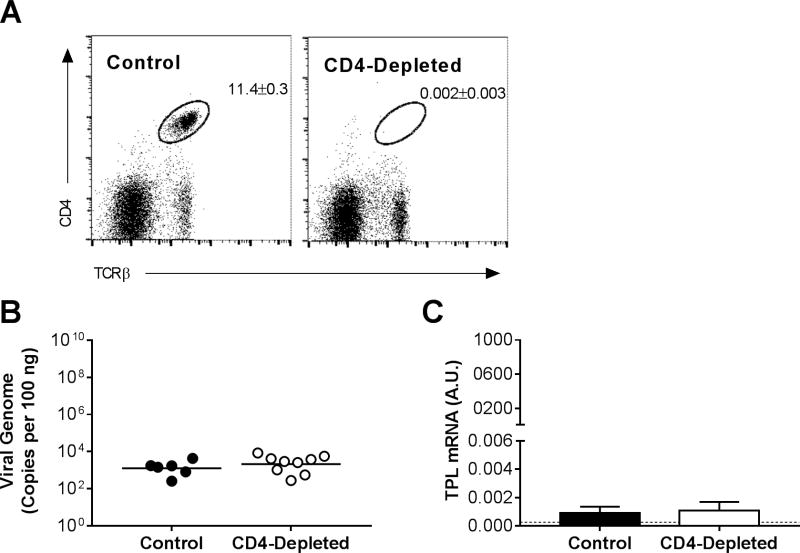
Figure 3.
Effects of CD4 T cells on MAV-1 replication in the lung. CD4 T cells were depleted from B6 mice using anti-CD4 antibody. Control mice received a nonspecific IgG control antibody. Mice were infected intranasally with MAV-1, and lungs were harvested at 14 dpi. (A) Flow cytometry was used to assess CD4 T cell depletion in a subset of mice. Splenocytes were analyzed for individual mice, and dot plots for one representative mouse of each group are shown. Percentages of CD4 T cells (CD4+, TCRβ+; n=2–4 mice per group; means ± S.E.M.) are indicated in the upper right quadrant for each group. (B) qPCR was used to quantify MAV-1 genome copies in the lungs. DNA viral loads are expressed as copies of MAV-1 genome per 100 ng of input DNA. Individual circles represent values for individual mice from two independent experiments, and horizontal bars represent means for each group. (C) RT-qPCR was used to quantify MAV-1 TPL mRNA levels in the lungs. Data are shown in arbitrary units standardized to GAPDH (means ± S.E.M.). The horizontal dashed line represents the limit of detection based on background levels detected in mock-infected B6 mice. No statistically significant differences among groups in B or C were detected.

