Figure 7.
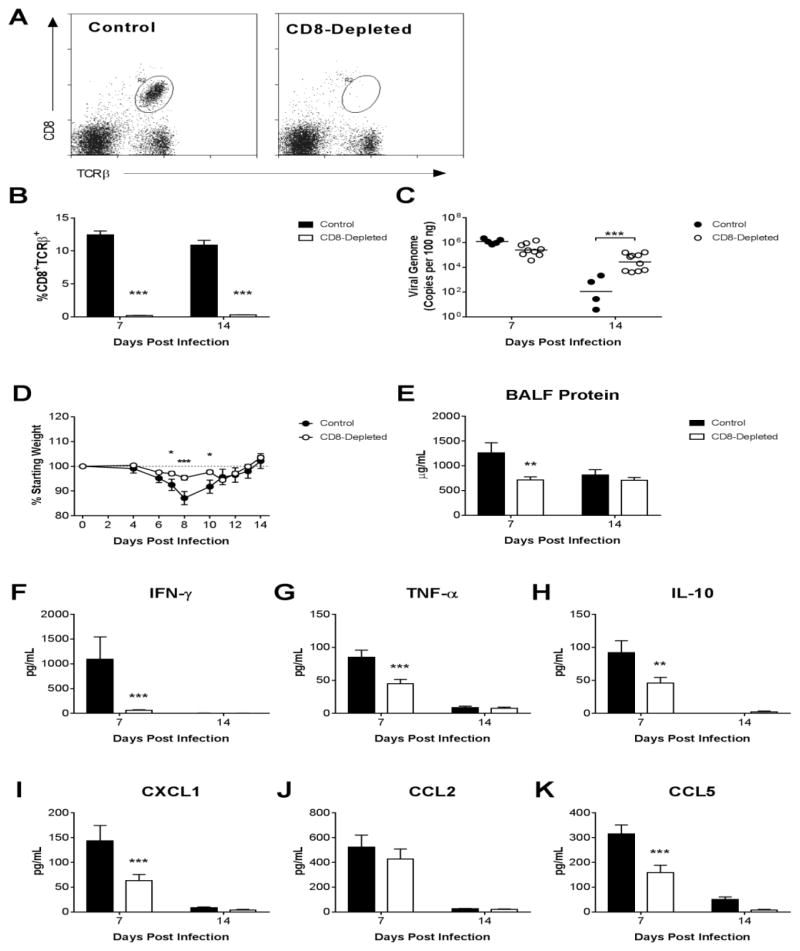
Effects of CD8 depletion on virus clearance and airway inflammation. Following intranasal infection with MAV-1, CD8 T cells were depleted from B6 mice using anti-CD8 antibody. Control mice received a nonspecific IgG control antibody. (A) Flow cytometry was used to identify splenocytes that were CD8 T cells (CD8+, TCRβ+). Representative dot plots at 7 dpi are shown. (B) Flow cytometry data are summarized to indicate the percentages of splenocytes that were CD8 T cells at the indicated time points. (C) qPCR was used to quantify MAV-1 genome copies in the lungs. DNA viral loads are expressed as copies of MAV-1 genome per 100 ng of input DNA. (D) Body weights are expressed as the percentage of starting weight. (E) Total protein concentration was measured in BALF. (F–K) ELISA was used to quantify cytokine and chemokine protein concentrations in BALF. In B individual circles represent values for individual mice one experiment, and horizontal bars represent means for each group. Data in E-K are presented as means ± S.E.M. (n=4–10 mice per group at each time point from one experiment; in D, n=8–19 per group up to 7 dpi, then n=4–10 per group up to 14 dpi). Statistical comparisons were made using two-way ANOVA followed by Bonferroni’s multiple comparison tests. *P<0.05, **P<0.01, and ***P<0.001.

