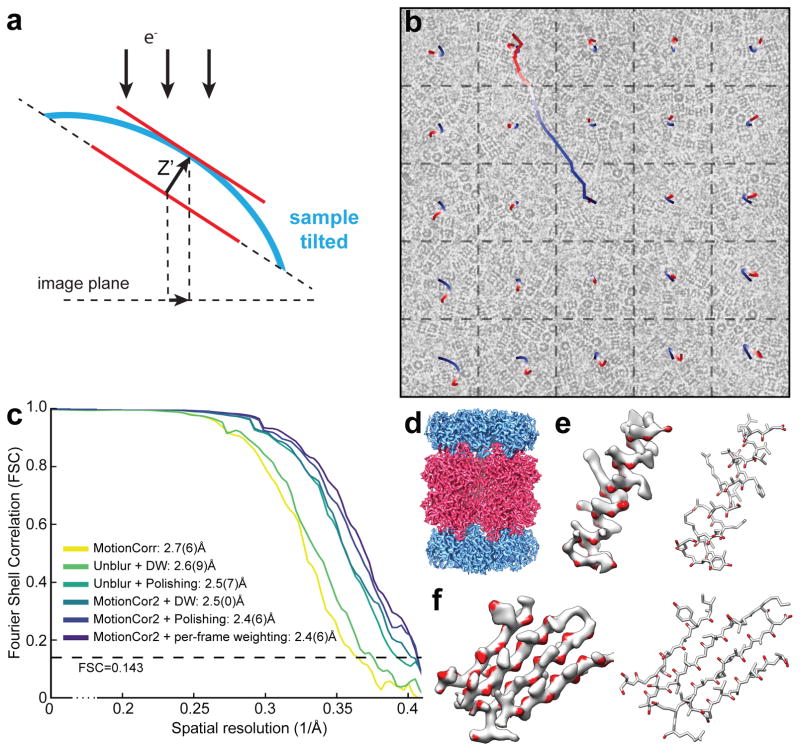
Figure 1. Local motion correction by MotionCor2.
(a) Schematic drawing illustrates that, when the sample is tilted, the observable motions in the image plan is the projection of z-motion produced by doming of the sample under electron beam. (b) Image of frozen hydrated archaeal 20S proteasome overlaid with the traces of global motion based upon whole frame alignment (long trace originated from the center of image) and each patch predicted from the polynomial function. (c) Fourier Shell Correlation (FSC) curves of 3D reconstructions determined using micrographs corrected by Unblur with dose weighting, Unblur followed by particle polishing, correction by MotionCor2 with dose-weighting, MotionCor2 followed by particle polishing and MotionCor2 with per-frame B-factor weighting. The color code is marked in the figure. (d) 3D reconstruction of archaeal 20S proteasome filtered to 2.5Å resolution and sharpened by a temperature factor of –103.8Å2. (e) Density of a β-sheet, where the main chain carbonyl is colored in red. Visualization of main chain carbonyl density requires better a resolution that is better than 3Å. (f) Representative side chain densities.

