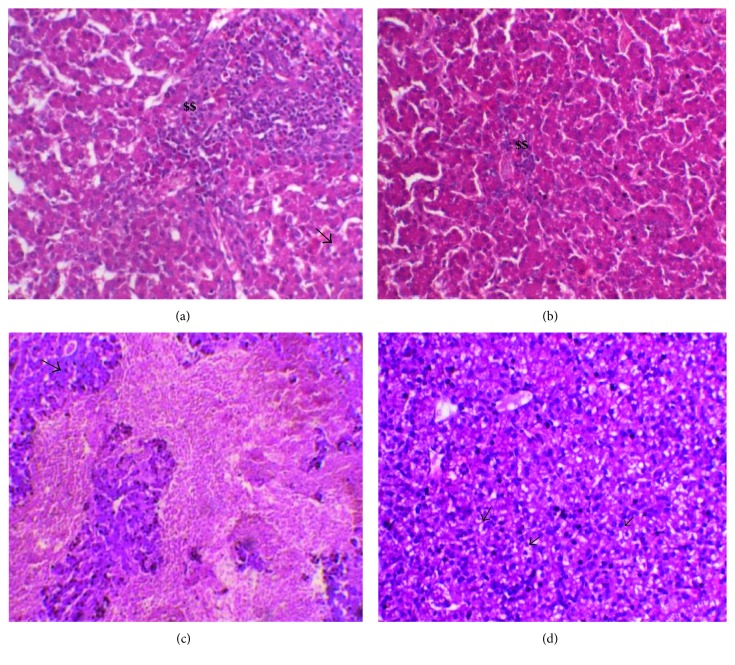
Figure 2.
Hematoxylin and eosin staining of liver sections of Ross 308 and Cobb 500: (a) Ross exposed to white light during heat stress H + W and (b) Ross housed with blue light during heat stress H + B. (c, d) The same treatment in the case of Cobb, respectively. $$ refers to mononuclear cell infiltration. Arrows point the fatty changes.

