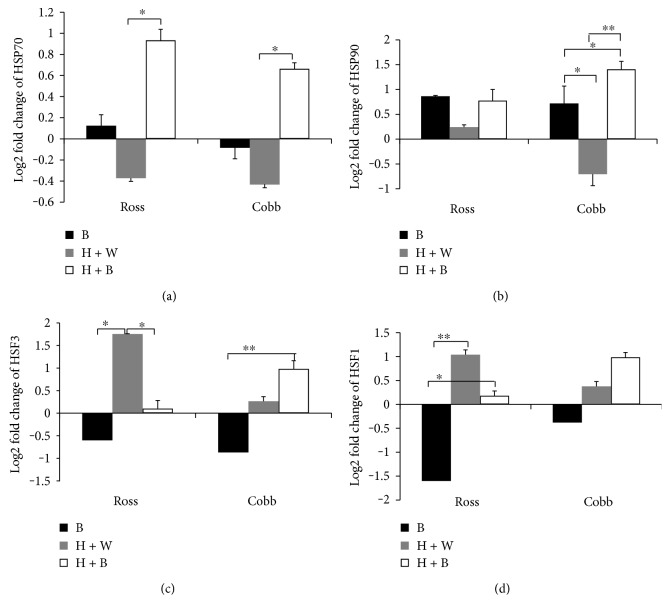
Figure 3.
Blue light significantly modulates liver HSP70, HSP90, HSF1, and HSF3 gene expression in the chicken liver. The relative gene expression levels of HSP70, HSP90, HSF3, and HSF1in the liver of Ross and Cobb exposed to blue light, heat stress in white light, and heat stress in blue light (B, H + W, and H + B, resp.) were measured. The gene expression levels were normalized against control (W) and against two housekeeping genes (β-actin and GAPDH). The expression levels were presented as log2 fold change and shown in the figure as mean ± SEM. ∗, ∗∗, and ∗∗∗ denote statistical significance (two-way ANOVA) with a p < 0.05, p < 0.01, and p < 0.001, respectively.

