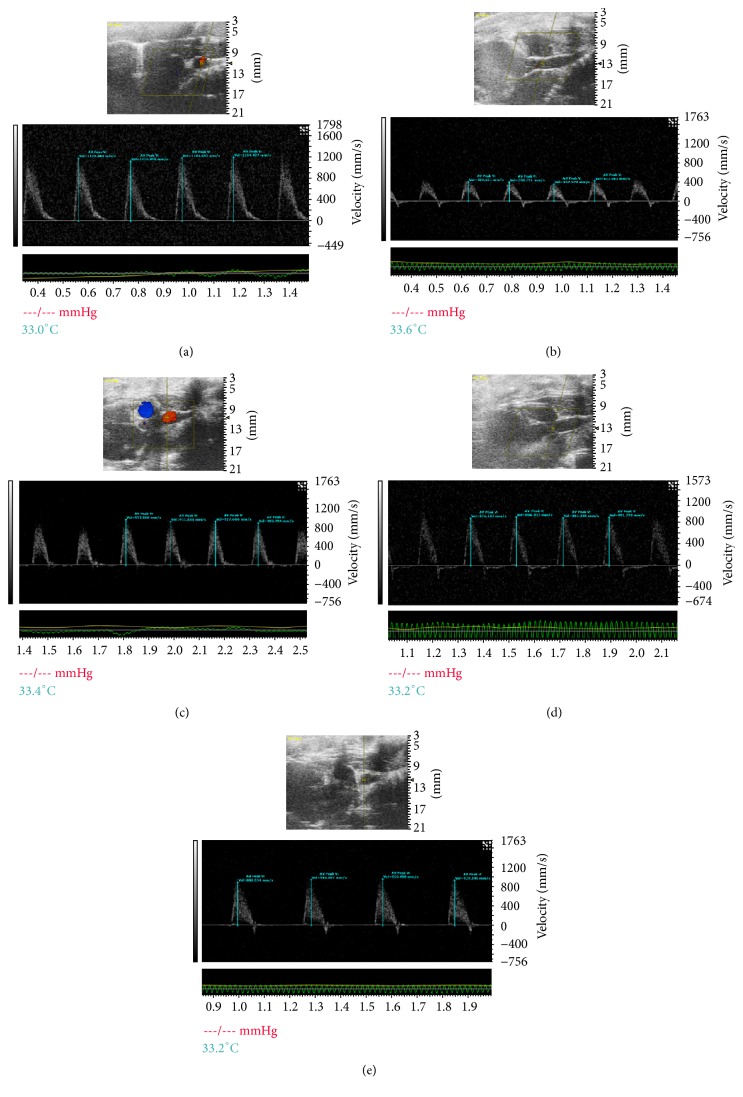
Figure 3.
Representative transmitral valvular flow profiles and the color images acquired by color Doppler ultrasonography after 4-week drug administration, where the white shadow represents the aortic flow velocity. Notes. (a) Sham group, (b) HF group, (c) Valsartan + HF group, (d) SFI 1.5 mL/kg + HF group, and (e) SFI 0.75 mL/kg + HF group. HF, heart failure; SFI, Shenfu injection.

