. 2017 Jun 15;2017:7075601. doi: 10.1155/2017/7075601
Copyright © 2017 Daniel Wilfred Gunda et al.
This is an open access article distributed under the Creative Commons Attribution License, which permits unrestricted use, distribution, and reproduction in any medium, provided the original work is properly cited.
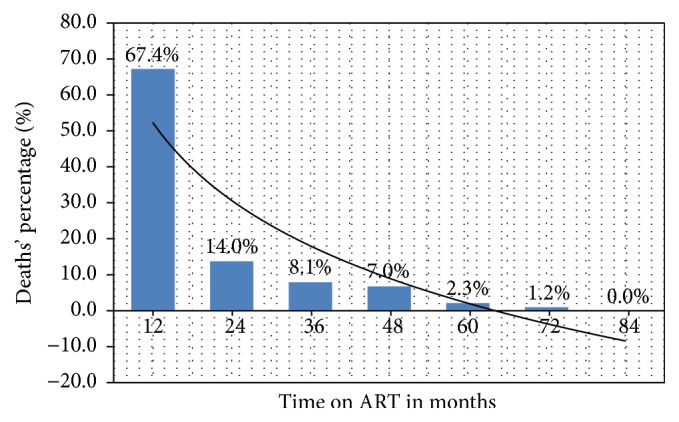
Figure 2.

The distribution of deaths by months on ART.
