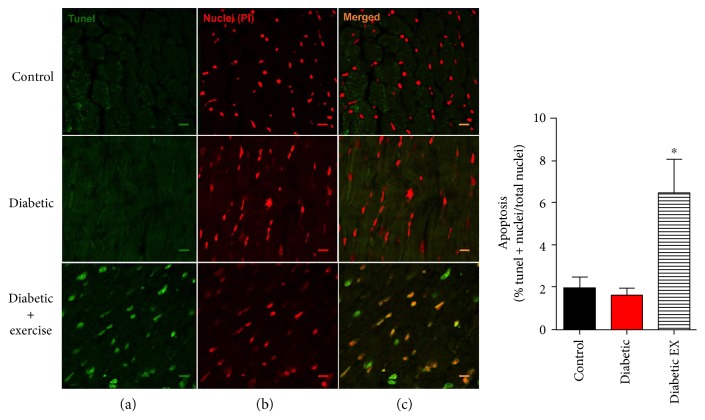
Figure 4.
Cardiac apoptosis. Assessment of apoptosis by TUNEL. (a) Photomicrographs (green channel) show the positive nuclei for the TUNEL reaction of the representative cardiac sections from the control (nondiabetic), diabetic, and diabetic + exercise rats, n = 5 hearts in each group. (b) Photomicrographs (red channel) show total nuclei of the same sections stained with propidium iodide. (c) Photomicrographs show the merged signal for both channels. The scale bar indicates 10 μm. ∗p < 0.05 versus the other groups.

