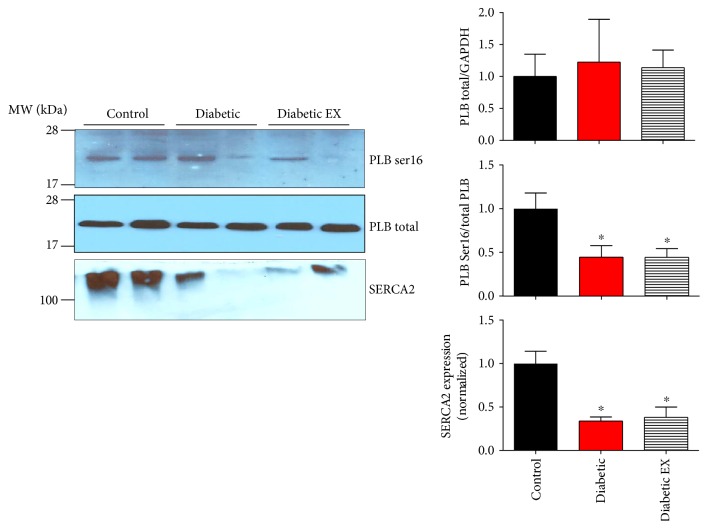
Figure 8.
Phospholamban phosphorylation and SERCA2 expression. Levels of phospholamban (PLB) phosphorylation in control (non-diabetic), diabetic, and diabetic rats submitted to exercise training (diabetic EX). Representative Western blots for the phosphorylated form of phospholamban at serine 16 (PLB Ser16), total phospholamban (PLB), and SERCA2 from cardiac homogenates. The bar graphs correspond to the densitometry analysis for 5 hearts in each group. ∗p < 0.05 versus control.

