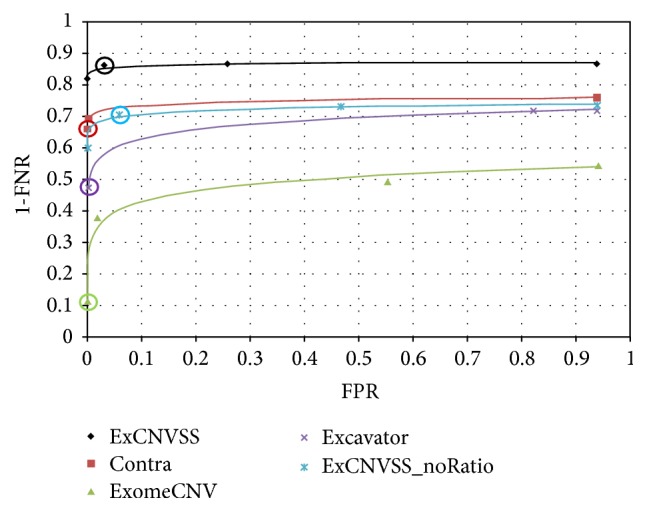
Figure 2.

The ROC curves of the five methods. FNRs and FPRs were calculated on 11 simulated data sets at different threshold levels, and ROC curves were generated on the basis of averaged values. The circled symbol on each curve represents the performance of each method using default parameters.
