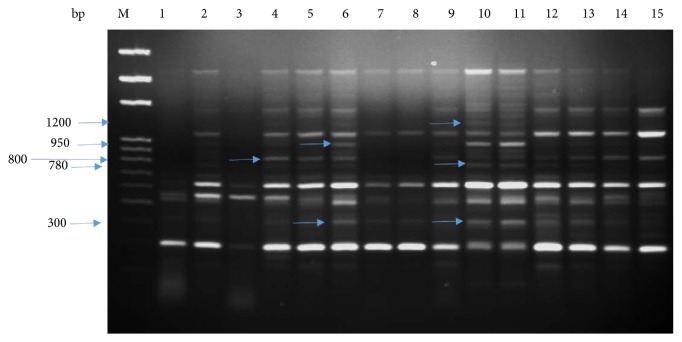
Figure 11.
cDNA-SCoT marker profiling generated from individual plant leaf of Phoenix dactylifera at different concentrations of NaCl (SCoT primer 3). Lane M: 100 bp ladder; lanes 1, 2, and 3 (control); lanes 4, 5, 6, and 7 (50 mM NaCl); lanes 8, 9, 10, and 11 (100 mM NaCl); lanes 12, 13, 14, and 15 (150 mM NaCl).

